Running LOGO in Python

Learning to code as a cross-grade level educational goal seems an educational trend. I attribute this to two factors: a) assumptions about the vocational potential of having coding skills and b) the promotion that coding experiences develop computational thinking which while somewhat ambiguous seems a form of higher-order thinking.

There are many strategies for how to go about learning coding and what type of coding is appropriate for students at different grade levels. We include a chapter on coding in our textbook and I have generated related resources available online. One of the interesting issues I think has received little attention is the transfer value of learning in what might be described as a coding language and environment designed to teach core coding concepts while reducing many of the demands of working in a traditional programming language to the development of proficiency in the traditional language. For example, many of the educational coding environments for younger learners use icons instead of text. 

When I began writing about coding in the early 1990s, I mostly focused on the logic and specifics of LOGO. This was a text-based language, but somewhat forgiving when it came to syntax. Such text-based approaches eventually gave way to icon-based systems assumed to allow a focus on coding concepts without the demands of exact syntax.

A grad student in one of my classes was interested in the Python programming language and found that Python could import a subset of commands for LOGO. She was working on tutorials to guide students in the use of this implementation of LOGO. I had loaded Python on my Mac, but had not really done much with the language. I kind of need a project to motivate my exploration. However, I was familiar with LOGO and this was enough to encourage my exploration. What follows is my description of what others might do to explore. I see some opportunity in the natural transition that might occur using a language within a language. 

Getting your system set up was my biggest obstacle. I will explain why as I continue. 

Get Python from a reliable source

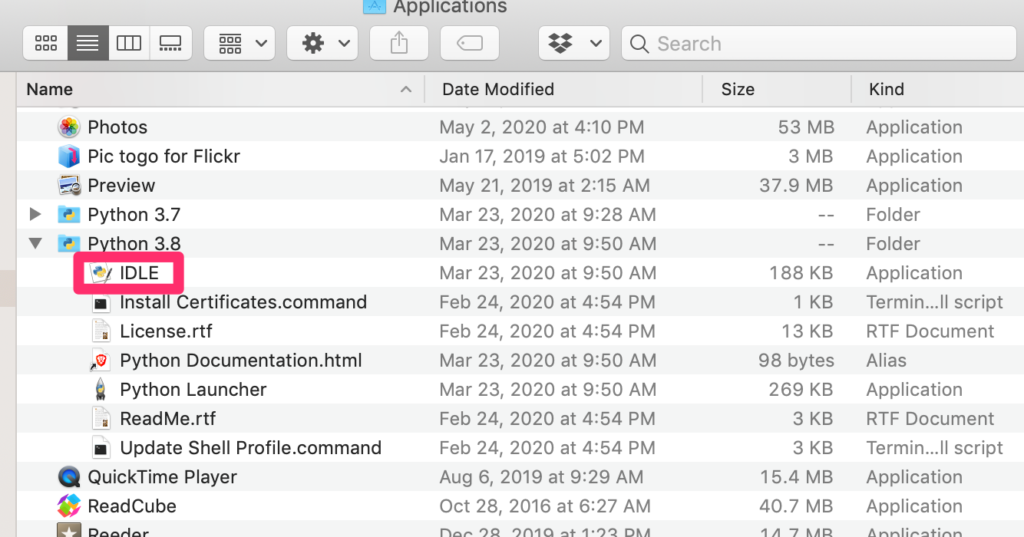
Python will be saved as a folder in your applications list. Python is accessed from the Terminal. The easiest way to activate the Terminal and Python within the terminal is to use the IDLE app that appears in the Python folder [see image]. I just drag IDLE to the toolbar at the bottom of the screen for easy access. IDLE is an Integrated Development Environment (IDE) including a code editor and debugger. The code editor is the tool within which you write Python code.

It is easy to find tutorials for Python on the Internet. The tutorials are great as far as the coding itself was concerned and my background allowed me to make assumptions about how things are accomplished via code. My existing experience with coding in other languages made exploring a new situation fairly easy. Once you are used to defining variables, loops, conditionals, etc., the basics come easily. I have not moved past the basics. What I struggled with were some very basic things I needed to know for saving, loading, and running code. I had to look around for a while to get past writing and running code within the IDLE window. The key came from a YouTube video that allowed me to understand that you simply open a file from within the Terminal and enter your code in this blank file rather than enter code in the Terminal and then save your work as a file. This is evidently so obvious to those creating tutorials that they fail to mention the difference. If you create two files in the ways I have described and examine what is saved in both cases, you immediately see the difference. 

There is little value of me developing complete tutorials as others have already done an excellent job. Here are a couple of resources.

Basics of Python

https://www.freecodecamp.org/news/the-ultimate-guide-to-python-from-beginner-to-intermediate-to-pro/amp/

Python Turtle

Python Turtle

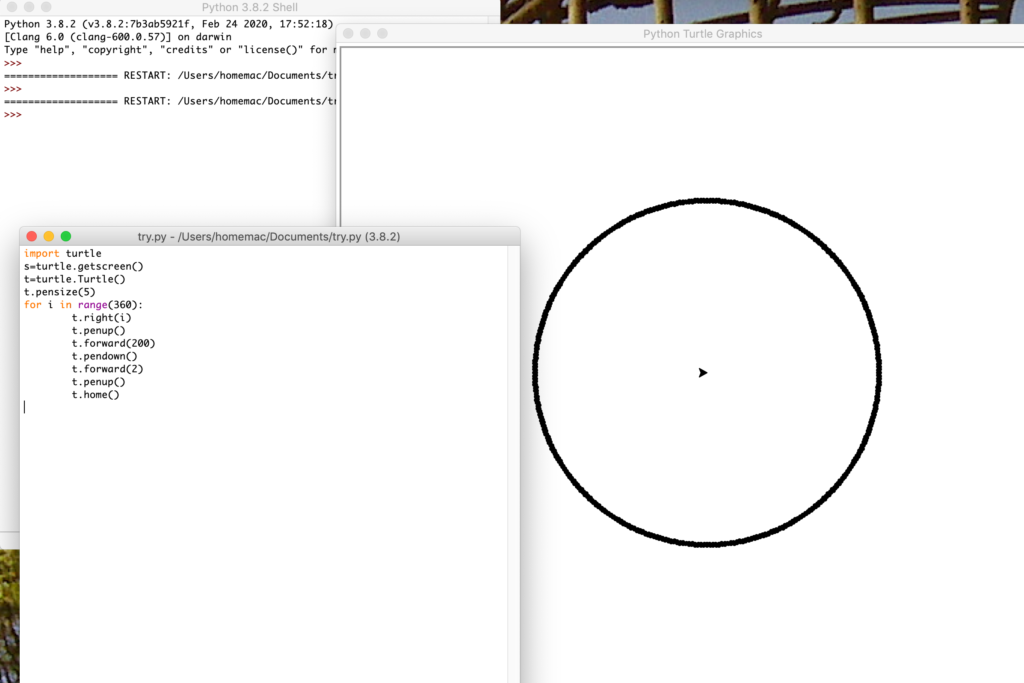
An example I like to use to explain Seymour Papert’s concept of computational understanding of geometry (in contrast to Euclid’s logical or Descartes’ algebraic approach) using the example of understanding “circle”.  The important insight here is what it means to understand and how is understanding different from recalling. So, if you have taken geometry you have probably learned the definition of a circle as “a closed plane figure consisting of all points equidistant from a point”. The circle program I write in LOGO demonstrates what this means. It starts from a point, moves forward the number of turtle steps specified, makes a point, and then returns home. It then turns one degree and repeats the process. Do this 360 time and you have computationally drawn a circle.

The following image demonstrates what this would look like. It shows the Terminal window, the commands in a new file window, and the window containing the result of running the program. 

This video shows the program being executed.

Loading

Teacher as Designer – Part 2

This post continues my discussion of teacher generated structured learning models. The first post considered hyperdocs and webquests. Here I will consider two tactics I use and for lack of well-used and promoted titles I will call the interactive syllabus and the layered online resource

Interactive Syllabus

The concept of an interactive syllabus is a concept I proposed as part of my interest in a different model of textbooks. When we parted ways with our publisher over our interest in a different approach to offering a textbook for what I sometimes describe as the “technology for teachers” course, one of the ideas in justifying the combination of a core Primer and online resources concerned the advantages of pairing down the traditional book and combining this Primer with a variety of online content. The online content offered the opportunity to keep content as current as possible, but also allowed an expansion of the material offered. For reasons of cost, a traditional textbook must make decisions about what is to be included. The existing publishing offering would likely contain things that were not considered valuable to an instructor imagining his/her course and would not include content the authors could have included but did not. For example, the authors probably did not discuss important research articles and how these studies were conducted for a course that might be assigned for a sophomore course for future teachers. Grad students might have been interested in the specifics of some of the key research articles that were used to justify specific classroom practices.

The idea of the interactive syllabus was proposed as a way to integrate the Primer and the author developed content an instructor could select to assign as well as other online resources from other sources the instructor wanted the student to read. The interactive syllabus was a way to structure the combination of resources and to link directly the resources that were online. [example]

An interactive syllabus need not be based on the model of a Primer and online resources as I have described. An interactive syllabus is essentially a web site with the home page representing the course overview and essentials and individual web pages identifying the content to be reviewed for a given unit/lesson and related activities. I have been using Google sites to create interactive syllabi for my own courses. A website is pretty much the basic model for all of these concepts whether implemented as interrelated blog pages, google docs, or some other way of putting content and links online.

Layering

Layering is another term I decided was descriptive of a group of online services suited to adding elements to existing web pages or online videos. To me, the idea was that educators as designers could add elements to existing web content as a way of improving the educational value of these online resources. The online elements could serve to activate existing knowledge relevant to the novel online material, to encourage processing of the online material, and evaluate understanding as a way to identify failed understanding and improve retention. These added elements could include highlighting, added comments, questions, links to additional information, discussion triggers, and similar supports for learning.

I have a collection of tutorials describing specific services and how these services work. I would also encourage review of an introductory video I created to explain the concepts of design and layering.

Loading

Hyperdocs, webquests, and other teacher created designs

A hyperdoc is not a webquest. This was the title of a post that got me started on this new writing project. I knew about webquests. I read everything I could find about webquests when they were the “in thing”. I assigned webquests and I wrote some of my own.

I have also explored the description of hyperdocs and assigned the Hyperdoc Handbook in one of the graduate courses I teach. 

My reaction to the claim that a hyperdoc is not a webquest would go something like this. As described by those who originated each model, I would agree that there are differences. At the level of the formal declarations by those originating the terms and the associated models, I would argue the webquest would be a subcategory of hyperdoc. I understood the concept of a webquest to be a scaffolded problem solving task and hyperdocs as more an approach to organizing a wider variety of learning experiences. However, at the level of application I don’t see a great difference. Many webquests were not really focused on problem solving and could be anything from direct instruction based on “read this content and answer these questions” to a type of Internet-based scavenger hunt. What both concepts share is the notion of an organized process controlled from a digital document of some type.

In this time of required online learning for all, I can understand how approaches of this type are being encouraged as ways for educators to think about how they might diversify learning experiences for students. It is not practical to translate the face to face classroom as an online experience. The issue goes beyond how long teacher and student will stare at each other via a computer screen. Part of the new reality is how to create guided learning experiences when the student does not have the same access to the teacher or other students. Guided learning tasks that can be organized through a conveniently referenced source make sense. 

From my perspective, webquests and hyperdocs and the logic of each are part of a broader topic I would describe as instructional design and more specifically educator as instructional designer. This broader perspective is based in an understanding of what learning is and how educators can encourage learning in students through the selection of content and the assignment of tasks intended to encourage productive cognitive behaviors. More on this in a future post or two and on some other broad teacher as designer approaches.

For those unfamiliar with hyperdocs, here are a couple of sources to offer you the core idea and to direct you to related resources. 

ENTER THE HYPERDOC

This source offers the following description of a hyperdoc and I prefer to offer such a statement so we can agree what we are discussing.

“A HyperDoc is a digital document—such as a Google Doc—where all components of a learning cycle have been pulled together into one central hub. Within a single document, students are provided with hyperlinks to all of the resources they need to complete that learning cycle.”

Hyperdoc portal

This is the homesite for the group that originated this model, wrote the Hyperdoc handbook, and offers additional resources and online experiences.

Loading

Other data types

Those of us with programming experience are familiar with the concept of data types. When declaring a variable it might be necessary to declare the type of data that variable could hold,  e.g., integer, string, floating point number, which in part determined how that variable could be used. This notion that data can take different forms allowing different types of manipulation might be useful to the notion of “methods for learning with data”. To me, this way of differentiating types of data suited to different purposes might be compared to the distinction some researchers make between quantitative and qualitative research. Some data questions cannot be addressed by the collection and analysis of data that can be expressed as a numerical value and exposure to the methods and analytical techniques associated with other data types offers insights into how certain types of questions can be addressed.

A good example of a nonquantitative approach can be found in the work of historians. What is it historians must do to collect and analyze data to offer descriptions of historical events and trends? What can historians do to be precise and accurate in their summarizations? How can historians offer a description of the process they have applied so that other historians can “check their work”? The techniques historians learn to accomplish these goals are often described as the historian’s craft. This collection of values and techniques has meaning for historians in much the same way that I as an experimental psychologist might point to courses in statistics and research methods as the basis for teaching and learning how questions are answered in my field. 

There are ways in which students can have opportunities to explore components of the historian’s craft and be exposed to analytical methods of this type. For example, photographs represent a type of data historians might use to gain insight into historical events. Certainly, we all have viewed family photographs that offered a perspective on what life was like at a different point in time. How could many images be used to put together the “big picture” associated with some issue? Here are some useful resources offering suggestions for the use of photographs in this way.

Minnesota historical society

Photo restoration project

Comments on the value of other primary and secondary historical sources

You never know when you could be in a position to apply the historian’s craft or engage your students in such methods of learning with data. We all have historical sources in our attics and other family storage sites. My brother recently began creating digital records of letters my father had sent home to his sister when heading off to fight in World War II. You wouldn’t know it from the sample I provide here, but he ended up in South Pacific as a radar operator. Making sense of letters and diaries

Loading

Data Literacy Project

I started this series on the “methods of learning from data” (the phrase I have finally decided to use) because I thought K12 schools were missing an obvious opportunity. Partly, my motivation was prompted by the impact the coding advocates have achieved in gaining the support of the public and the interest of educators. The experiences of many students have changed as a consequence. While I value my own coding skills and the role the projects I have coded have played in my professional career, I still feel the broad role for coding some imagine lacks the evidence we should expect to make a drastic change beyond providing coding courses in high school. Put another way – computational thinking lacks credibility as a unique form of higher order thinking and I just don’t see the evidence that would warrant a drastic alteration of the curriculum. I think other tactics (e.g., writing across the curriculum) have demonstrated greater benefits in multiple content areas and other areas of emphasis (e.g., methods of learning from data) provide largely unexplored authentic activities for developing higher order thinking skills in multiple content areas.

As I have searched for similar positions, I found the data literacy emphasis that as far as I can tell was operationalized by library professionals. It seems to me that the big thinkers in the library community see the role of their profession more broadly than purchasing, recommending, and lending books and magazines. Librarians when describing the big picture suggest that they help others solve information problems. In developing the skills to accomplish this goal they might argue they help others become information problem solvers. 

From this perspective, data literacy would represent an example of the development of the skills involved in solving problems based on the collection and analysis of data. What the methods of collection are will vary depending on the type of problem. What the data are will vary in the same way. The skills of analysis will be more consistent across both methods and data types.

I don’t think it is necessary for me to summarize the content from the Data Literacy Project. They have put considerable effort into both the background and the classroom suggestions. Here are several links you may want to explore.

How you teach data literacy – this is the School Library Journal that first caught my attention.

Creating data literate students (download the book)

Web site for the Data Literacy Project

Loading

Probes

Probes provide a way to collect information from the environment and summarize it numerically. You use a probe when you check someone’s temperature with a medical thermometer or a thermometer that reports the temperature outside of your window. Our textbook devotes considerable space to the classroom use of probes as allowing student participation in authentic activities. Probes were a category of digital tool we emphasized in our expansion of the core ideas we first found in Jonassen’s description of mindtools. We describe an authentic task as mimicking the behavior of practitioners. There is a theoretical explanation for the benefits of contextualizing learning through the use of authentic tasks, but this is type of thing I explain in our textbook and not here.

Probes play an essential role in most sciences and engineering and the data generated are important inputs to mathematical and statistical calculations. Probes have long been promoted for classroom use. I used to see multiple booths at education conferences displaying the probes companies had available and demonstrating some of the types of information these probes could collect.  Student use of probes to conduct authentic investigations just seems such a logical fit with STEM initiatives and yet I don’t see the frequent use I expected when these devices first became available for classroom use. Again, probes represent another of the mysteries of why some ideas catch on in education and others do not. 

My recent example of the multi-function power consumption monitor would be the last example of a probe I have used. Here is another example of a probe (heart rate monitor) that you may have used personally applied to a novel investigation. The links at the end of this example offer access to some of the companies providing probes for classroom use. 

Probes = another opportunity for student data collection.

Loading

Data literacy – using data

As I have explored the topic for which I have yet to find a suitable descriptive phrase, I have encountered similar existing initiatives. Claiming originality should always be done with great care. One source I intend to use for several posts seems to have been the focus of school libraries who describe this topic as data literacy and see an important role for librarians relevant to this topic in guiding and supporting student activities in developing this literacy. Without a formal claim of responsibility, I am left to speculate regarding how the connection with the role of librarians explains their interest. My guess is that librarians see data literacy as involving answering certain questions based on a type of information resource (data sources) and librarians exist to help connect users with information resources. I will explore this position and provide some references as my series of learning to generate and use data continues.

One category of public data your librarian might acquaint you with would consist of datasets and databases such as what might be available from the CDC (https://www.cdc.gov/datastatistics/ – selected as an example because of our present situation) or data.gov (https://www.data.gov/). Various activities might be based on the analyses of the data provided. Before I retired, I was aware of academic colleagues who were applying advanced statistical procedures to public data to look for relationships among variables in data that had not been considered.

My example here is far less sophisticated. It is also not original as it is proposed by one agency providing such data. The data provided by the U.S. Department of Education (https://www2.ed.gov/rschstat/landing.jhtml) even proposes the use of a graphing tool students can apply to data – Kids’ Zone – Create a Graph (https://nces.ed.gov/nceskids/createagraph/).

I thought I would use graphing to explore data that interests me. The data that caught my attention was taken from a table summarizing 8th graders daily use of a computer broken down by various categories (Table 218.50). I think you can expand this image to read the two rows of data I am focusing on here. These data concern whether a given student qualifies for free/reduced lunch (a proxy for SES) and amount of use.

The data table can be downloaded as a xls file (the type of file for use in an Excel Spreadsheet or other spreadsheet program) or just read from the chart.

With a spreadsheet, I can select the cells that interest me and turn the values into a graphic representation.

With the Create a Graph program, the data would be entered directly from the keyboard to generate a similar representation.

Now we have bar graphs representing data summarizing 8th graders daily use of a computer. What can be observed? Perhaps you find the percentage of 8th graders who report no use interesting. What does this mean? What would you need to know about the methodology that would help you understand? For example, would an iPad be counted as a computer? What about the difference in family resources? The largest gaps are in the groups claiming no use and the group claiming a small amount of use? Here low income seems to matter. It does not seem to matter among the groups using a computer quite a bit. Do you wonder if this was because computers were provided by the schools and this is where most computer use occurred? Research always leads to more questions when the data are limited and the methodology does not allow an answer to questions asked after the process of data collection is complete.

I intend to write a couple more posts focused on the recommendations from the library association. I would describe my goals as very much overlapping with the way this association describes data literacy. If there is a distinction, I would describe it as my interest in data and data collection methods that are not numerical. If data literacy is limited to quantitative data, I must still find another terminology to describe this broader perspective.

Loading