Data literacy is an educational opportunity I see as commonly overlooked. The collection and analysis of data generalize to many academic areas and the critical thinking involved in evaluating the data collection methodology in combination with the data is key to understanding so many controversial topics.
Here is a unique example which might be useful in some classroom situations. Cornell University has created a feeder watch program that encourages user participation. Cornell provides round the clock access to some of the feeders they have set up and runs a winter citizen scientist feeder watch data collection program.
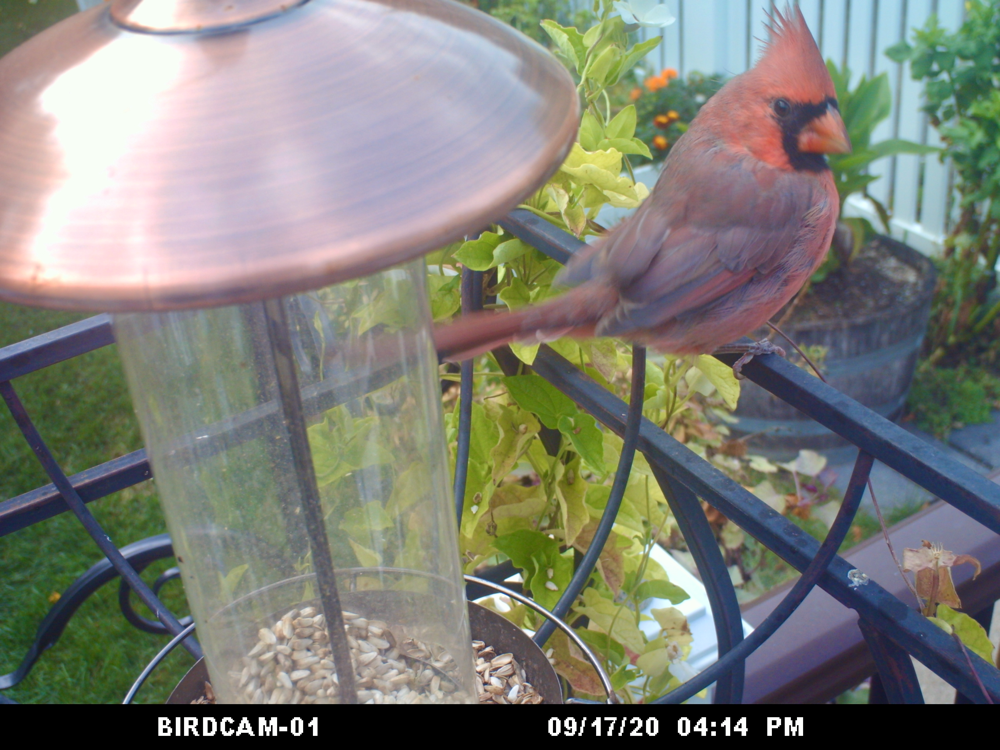
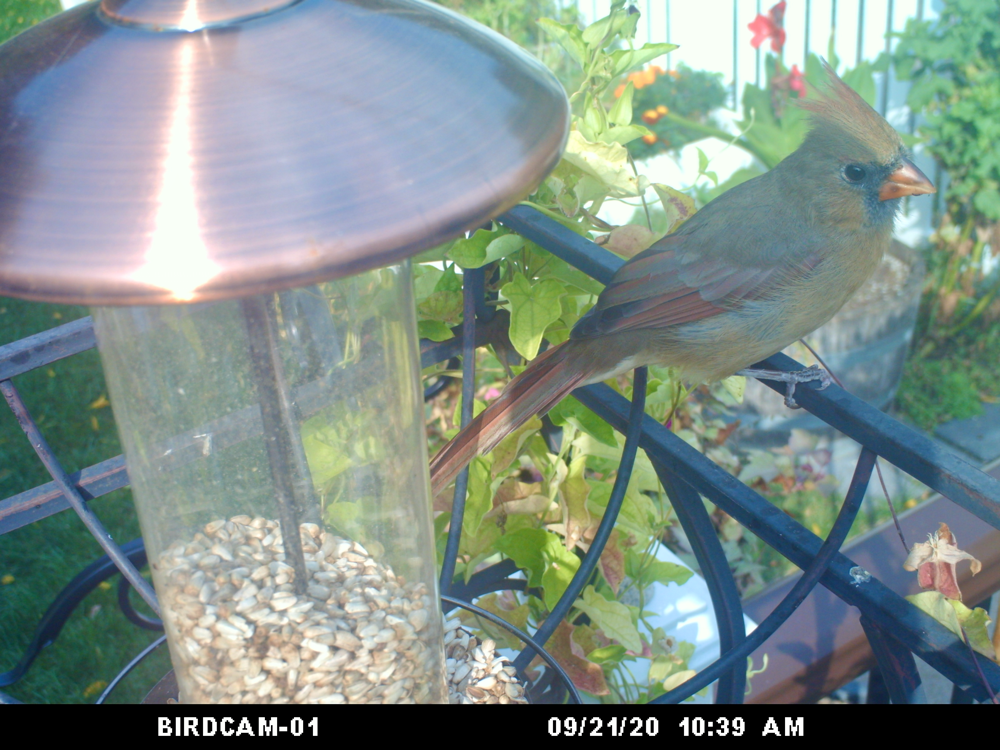
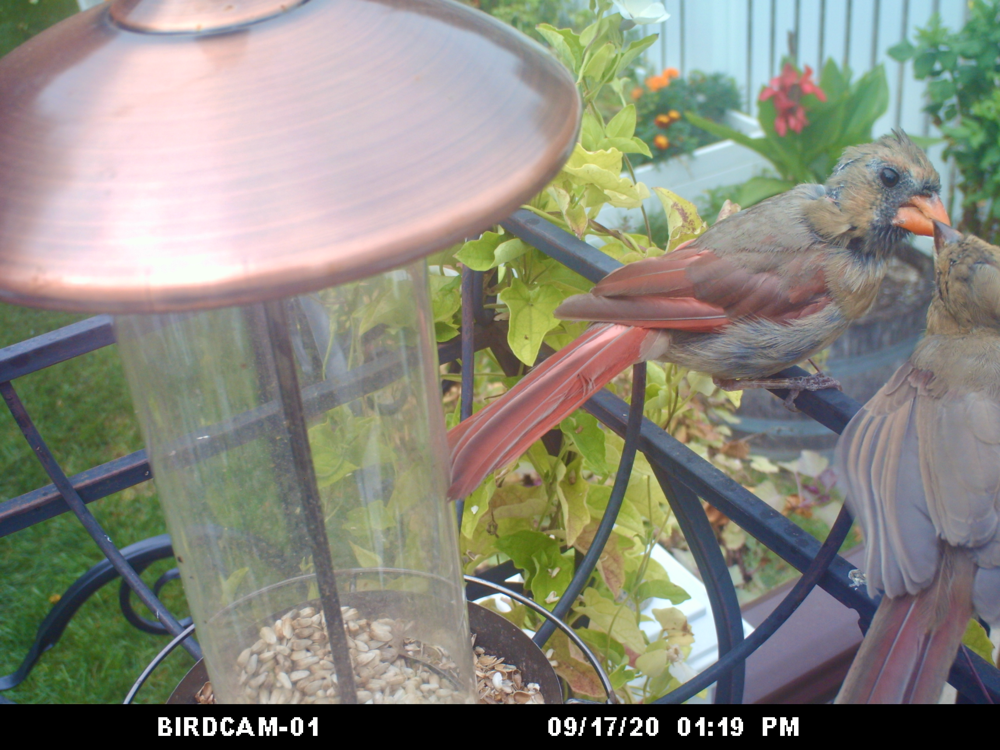
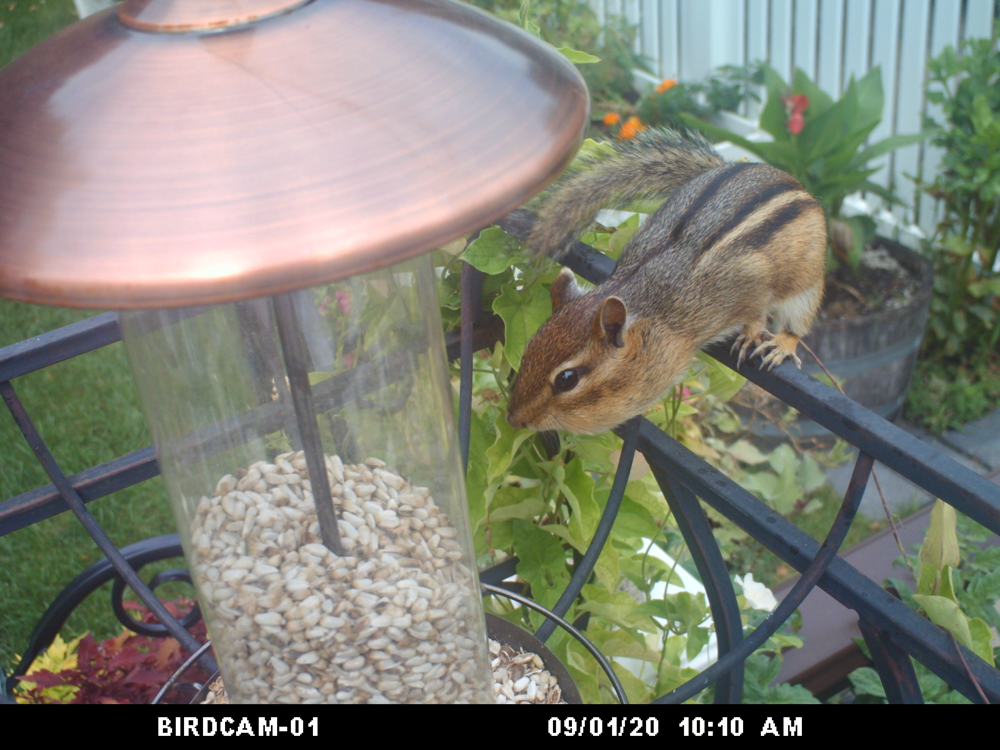
With plenty of time and limited opportunity for travel, I have been running my own feeder watch program. I feed birds at both my home in a suburb of Minneapolis and a cabin in Northern Wisconsin. Some years ago Cindy gave me a bird cam – a motion-activated camera similar to the type of cameras hunters use to look for the presence of game animals in a given area. The bird cam is a different lens system designed for taking images at a short distance.
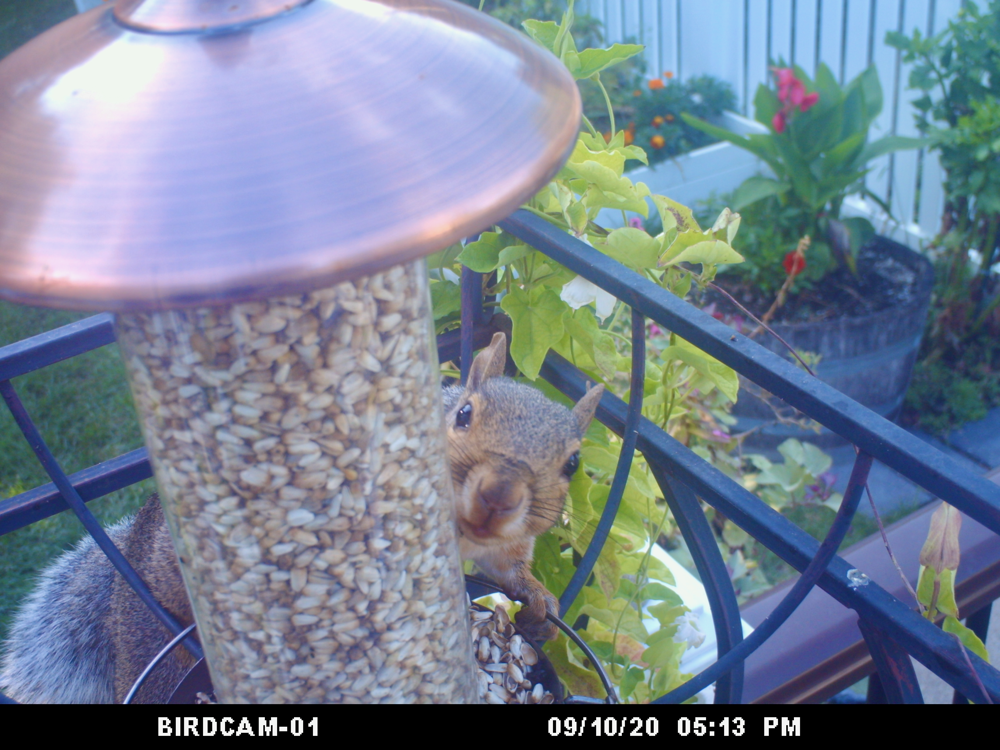
Many variables determine the type and frequency of birds you view. At our home in the city we feed safflower seed to reduce the attention our many squirrels pay to our feeder. Evidently squirrels do not like safflower seeds and it seems to work. We have many squirrels because of a large black walnut tree in our yard and squirrels love black sunflower which would normally be the seed I feed most heavily. Varying the type of food is one of the variables you can manipulate to study the quantity and diversity of birds you attract.
The bird cam I use would be great for doing bird counts. It has the advantage of recording the visitors and does not require watching in real time.
Those of us with programming experience are familiar with the concept of data types. When declaring a variable it might be necessary to declare the type of data that variable could hold, e.g., integer, string, floating point number, which in part determined how that variable could be used. This notion that data can take different forms allowing different types of manipulation might be useful to the notion of “methods for learning with data”. To me, this way of differentiating types of data suited to different purposes might be compared to the distinction some researchers make between quantitative and qualitative research. Some data questions cannot be addressed by the collection and analysis of data that can be expressed as a numerical value and exposure to the methods and analytical techniques associated with other data types offers insights into how certain types of questions can be addressed.
A good example of a nonquantitative approach can be found in the work of historians. What is it historians must do to collect and analyze data to offer descriptions of historical events and trends? What can historians do to be precise and accurate in their summarizations? How can historians offer a description of the process they have applied so that other historians can “check their work”? The techniques historians learn to accomplish these goals are often described as the historian’s craft. This collection of values and techniques has meaning for historians in much the same way that I as an experimental psychologist might point to courses in statistics and research methods as the basis for teaching and learning how questions are answered in my field.
There are ways in which students can have opportunities to explore components of the historian’s craft and be exposed to analytical methods of this type. For example, photographs represent a type of data historians might use to gain insight into historical events. Certainly, we all have viewed family photographs that offered a perspective on what life was like at a different point in time. How could many images be used to put together the “big picture” associated with some issue? Here are some useful resources offering suggestions for the use of photographs in this way.
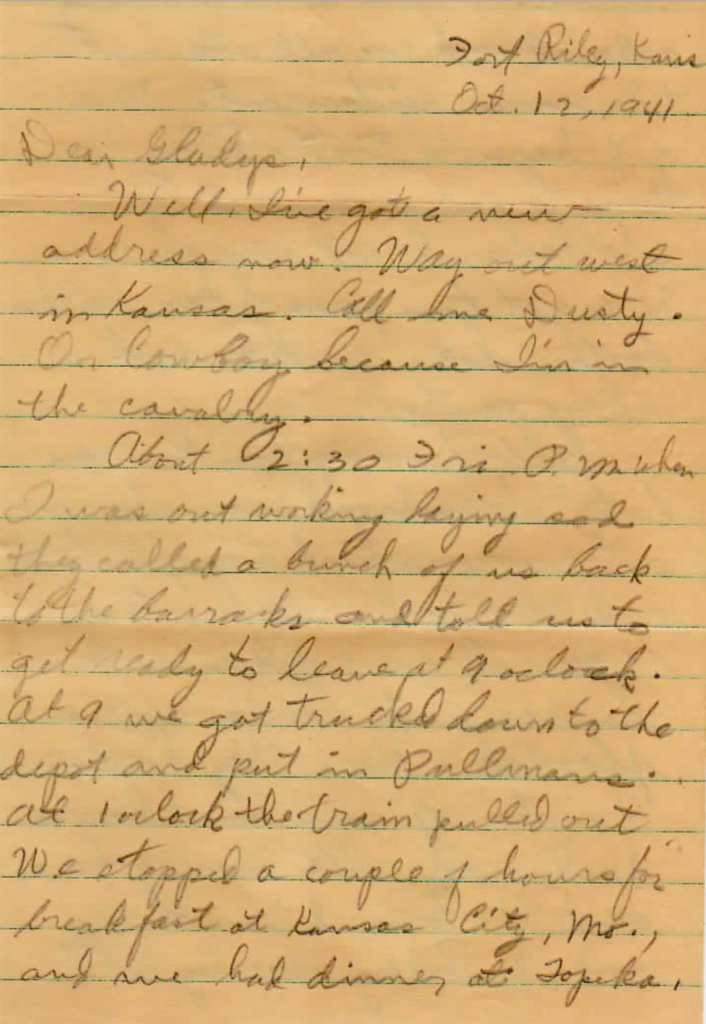
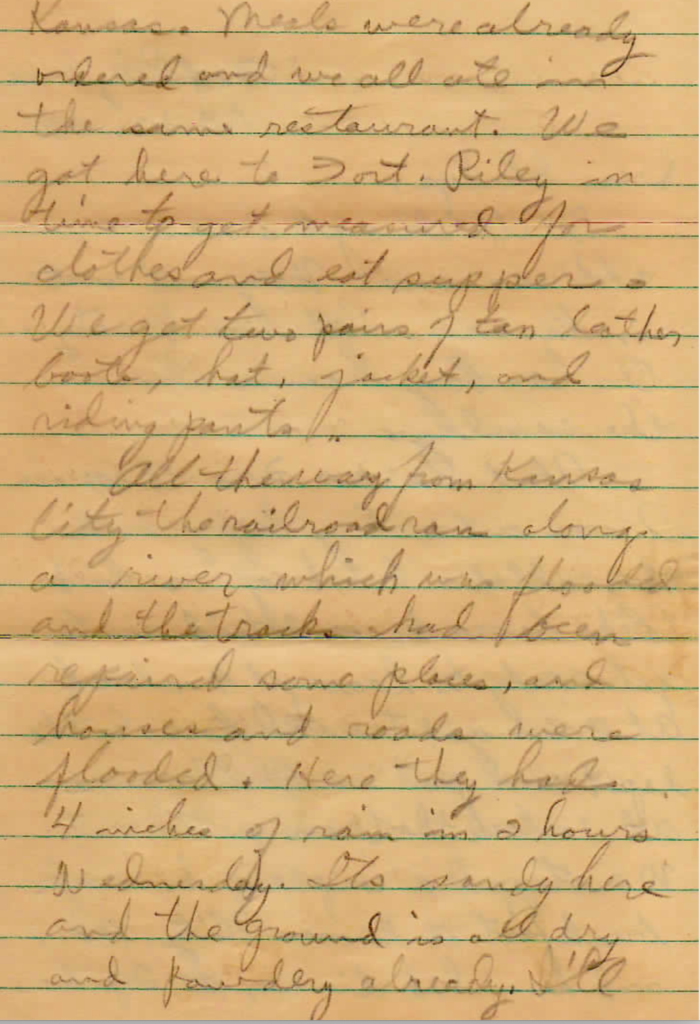
You never know when you could be in a position to apply the historian’s craft or engage your students in such methods of learning with data. We all have historical sources in our attics and other family storage sites. My brother recently began creating digital records of letters my father had sent home to his sister when heading off to fight in World War II. You wouldn’t know it from the sample I provide here, but he ended up in South Pacific as a radar operator. Making sense of letters and diaries
I started this series on the “methods of learning from data” (the phrase I have finally decided to use) because I thought K12 schools were missing an obvious opportunity. Partly, my motivation was prompted by the impact the coding advocates have achieved in gaining the support of the public and the interest of educators. The experiences of many students have changed as a consequence. While I value my own coding skills and the role the projects I have coded have played in my professional career, I still feel the broad role for coding some imagine lacks the evidence we should expect to make a drastic change beyond providing coding courses in high school. Put another way – computational thinking lacks credibility as a unique form of higher order thinking and I just don’t see the evidence that would warrant a drastic alteration of the curriculum. I think other tactics (e.g., writing across the curriculum) have demonstrated greater benefits in multiple content areas and other areas of emphasis (e.g., methods of learning from data) provide largely unexplored authentic activities for developing higher order thinking skills in multiple content areas.
As I have searched for similar positions, I found the data literacy emphasis that as far as I can tell was operationalized by library professionals. It seems to me that the big thinkers in the library community see the role of their profession more broadly than purchasing, recommending, and lending books and magazines. Librarians when describing the big picture suggest that they help others solve information problems. In developing the skills to accomplish this goal they might argue they help others become information problem solvers.
From this perspective, data literacy would represent an example of the development of the skills involved in solving problems based on the collection and analysis of data. What the methods of collection are will vary depending on the type of problem. What the data are will vary in the same way. The skills of analysis will be more consistent across both methods and data types.
I don’t think it is necessary for me to summarize the content from the Data Literacy Project. They have put considerable effort into both the background and the classroom suggestions. Here are several links you may want to explore.
Probes provide a way to collect information from the environment and summarize it numerically. You use a probe when you check someone’s temperature with a medical thermometer or a thermometer that reports the temperature outside of your window. Our textbook devotes considerable space to the classroom use of probes as allowing student participation in authentic activities. Probes were a category of digital tool we emphasized in our expansion of the core ideas we first found in Jonassen’s description of mindtools. We describe an authentic task as mimicking the behavior of practitioners. There is a theoretical explanation for the benefits of contextualizing learning through the use of authentic tasks, but this is type of thing I explain in our textbook and not here.
Probes play an essential role in most sciences and engineering and the data generated are important inputs to mathematical and statistical calculations. Probes have long been promoted for classroom use. I used to see multiple booths at education conferences displaying the probes companies had available and demonstrating some of the types of information these probes could collect. Student use of probes to conduct authentic investigations just seems such a logical fit with STEM initiatives and yet I don’t see the frequent use I expected when these devices first became available for classroom use. Again, probes represent another of the mysteries of why some ideas catch on in education and others do not.
My recent example of the multi-function power consumption monitor would be the last example of a probe I have used. Here is another example of a probe (heart rate monitor) that you may have used personally applied to a novel investigation. The links at the end of this example offer access to some of the companies providing probes for classroom use.
Probes = another opportunity for student data collection.
As I have explored the topic for which I have yet to find a suitable descriptive phrase, I have encountered similar existing initiatives. Claiming originality should always be done with great care. One source I intend to use for several posts seems to have been the focus of school libraries who describe this topic as data literacy and see an important role for librarians relevant to this topic in guiding and supporting student activities in developing this literacy. Without a formal claim of responsibility, I am left to speculate regarding how the connection with the role of librarians explains their interest. My guess is that librarians see data literacy as involving answering certain questions based on a type of information resource (data sources) and librarians exist to help connect users with information resources. I will explore this position and provide some references as my series of learning to generate and use data continues.
One category of public data your librarian might acquaint you with would consist of datasets and databases such as what might be available from the CDC (https://www.cdc.gov/datastatistics/ – selected as an example because of our present situation) or data.gov (https://www.data.gov/). Various activities might be based on the analyses of the data provided. Before I retired, I was aware of academic colleagues who were applying advanced statistical procedures to public data to look for relationships among variables in data that had not been considered.
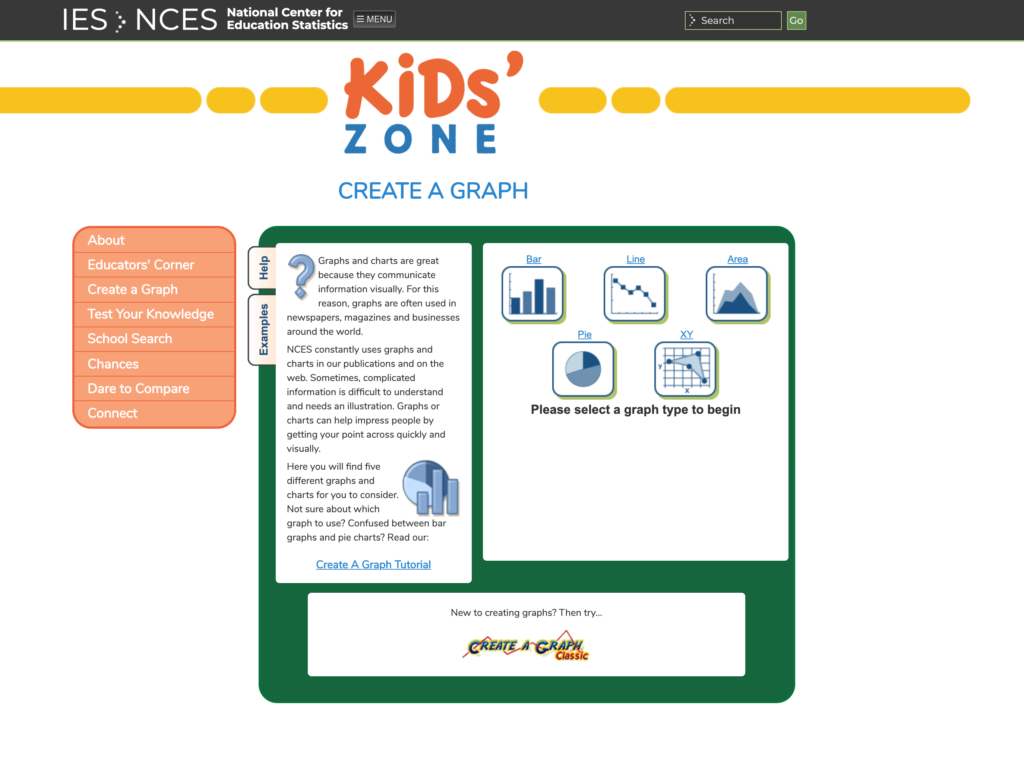
My example here is far less sophisticated. It is also not original as it is proposed by one agency providing such data. The data provided by the U.S. Department of Education (https://www2.ed.gov/rschstat/landing.jhtml) even proposes the use of a graphing tool students can apply to data – Kids’ Zone – Create a Graph (https://nces.ed.gov/nceskids/createagraph/).
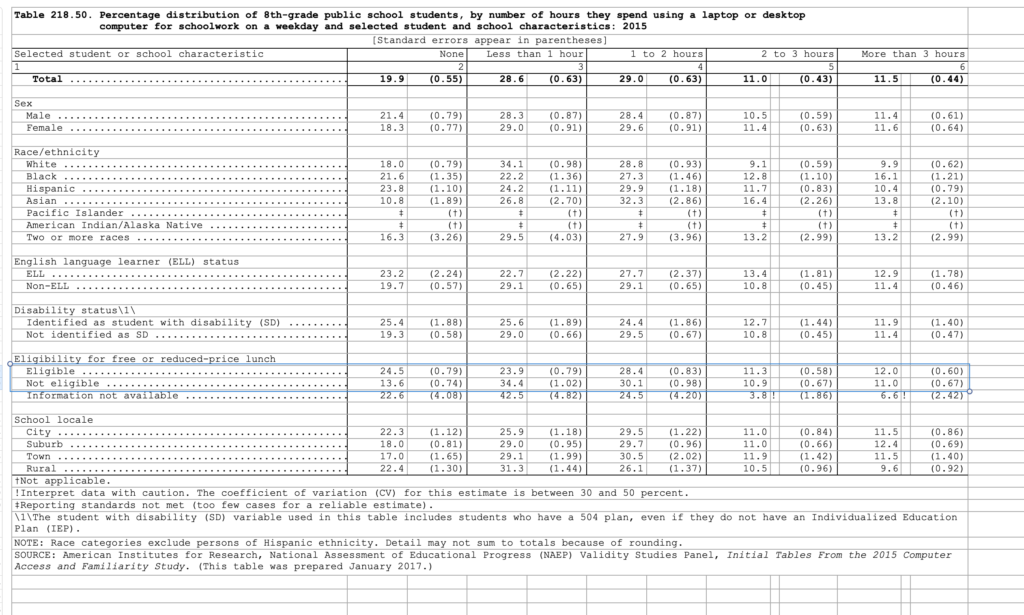
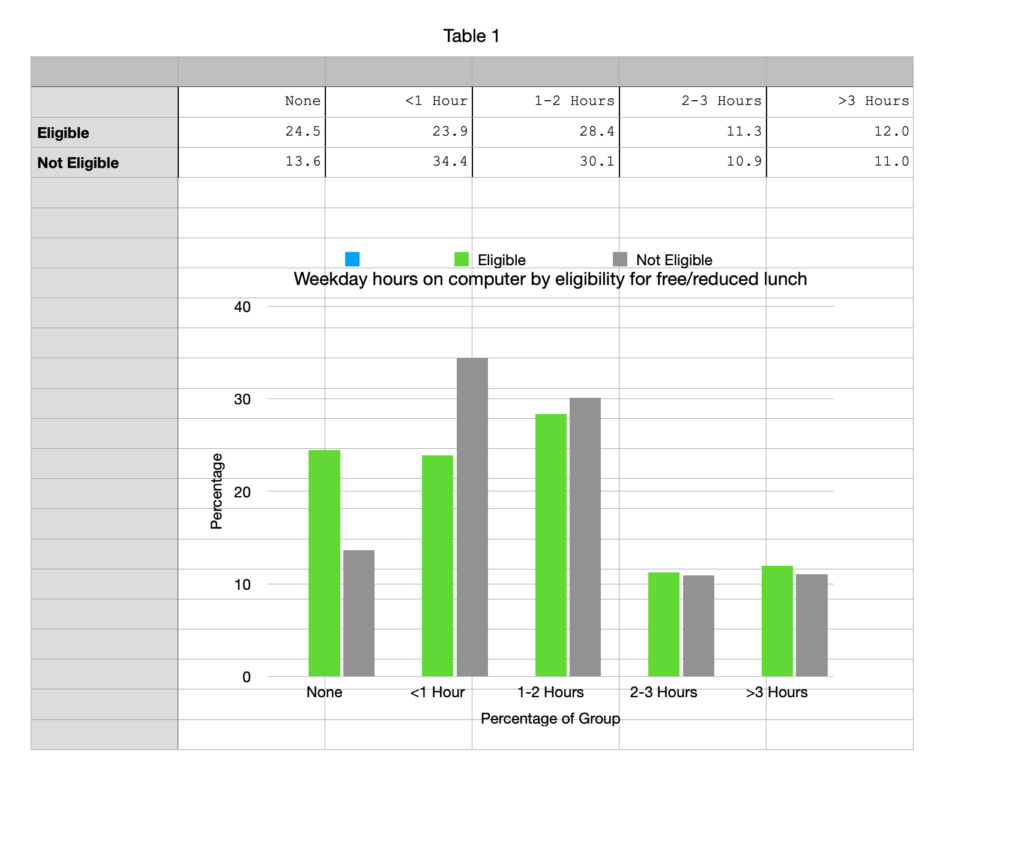
I thought I would use graphing to explore data that interests me. The data that caught my attention was taken from a table summarizing 8th graders daily use of a computer broken down by various categories (Table 218.50). I think you can expand this image to read the two rows of data I am focusing on here. These data concern whether a given student qualifies for free/reduced lunch (a proxy for SES) and amount of use.
The data table can be downloaded as a xls file (the type of file for use in an Excel Spreadsheet or other spreadsheet program) or just read from the chart.
With a spreadsheet, I can select the cells that interest me and turn the values into a graphic representation.
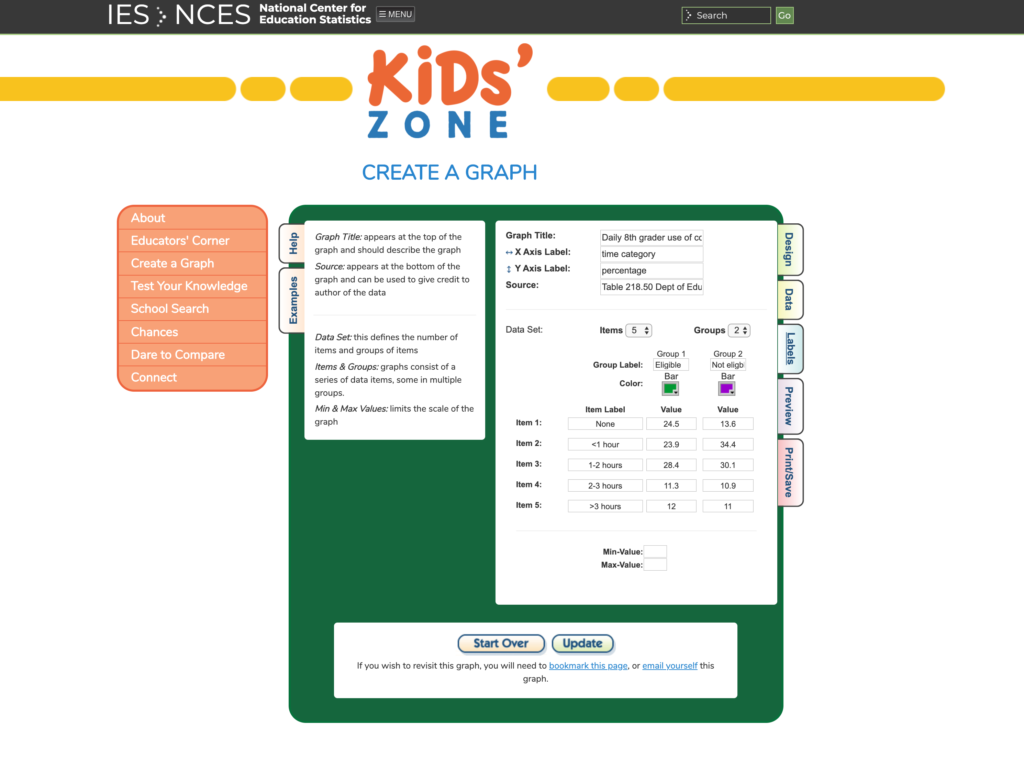
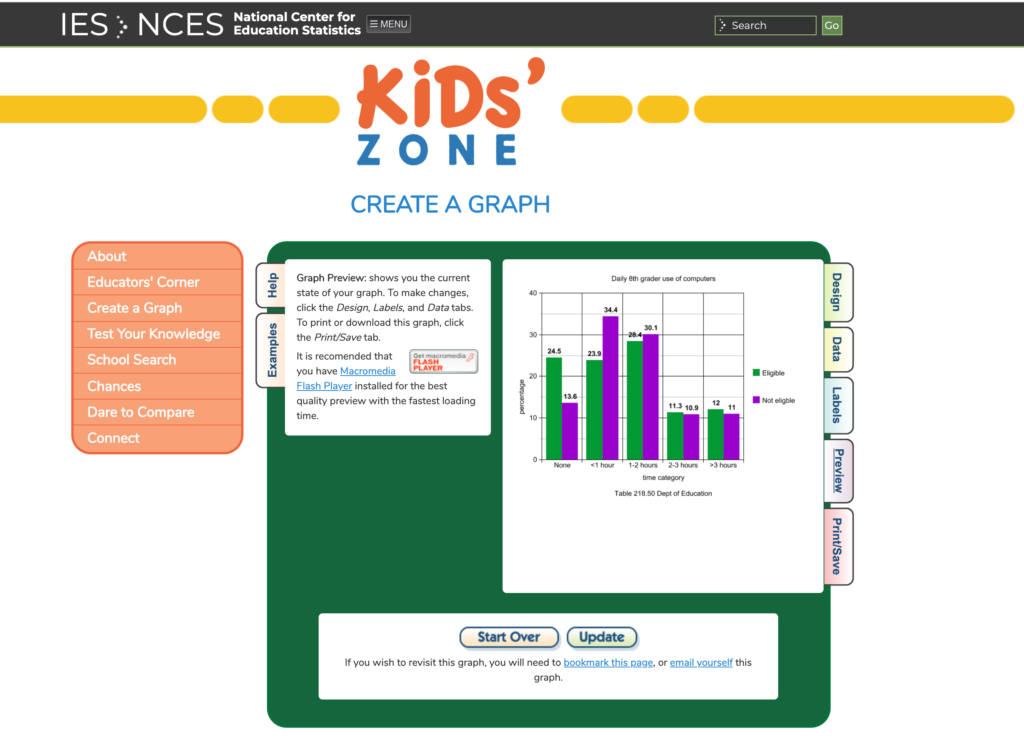
With the Create a Graph program, the data would be entered directly from the keyboard to generate a similar representation.
Now we have bar graphs representing data summarizing 8th graders daily use of a computer. What can be observed? Perhaps you find the percentage of 8th graders who report no use interesting. What does this mean? What would you need to know about the methodology that would help you understand? For example, would an iPad be counted as a computer? What about the difference in family resources? The largest gaps are in the groups claiming no use and the group claiming a small amount of use? Here low income seems to matter. It does not seem to matter among the groups using a computer quite a bit. Do you wonder if this was because computers were provided by the schools and this is where most computer use occurred? Research always leads to more questions when the data are limited and the methodology does not allow an answer to questions asked after the process of data collection is complete.
I intend to write a couple more posts focused on the recommendations from the library association. I would describe my goals as very much overlapping with the way this association describes data literacy. If there is a distinction, I would describe it as my interest in data and data collection methods that are not numerical. If data literacy is limited to quantitative data, I must still find another terminology to describe this broader perspective.
Energy consumption is an important component of so many issues. Energy consumption is a component of global warming and awareness can contribute to more thoughtful consumption or interest in a form of energy generation less dependent on fossil fuels. Energy consumption is a component of economics although for most of us the cost of the energy we consume is not a serious concern. What energy is in its various forms is a topic we learn about as part of our education. Typically, we learn about energy in a rather abstract way based on terms and formula. This is another post on the data and methods we might use to gain some insight into energy as it relates to the multiple topics I describe here.
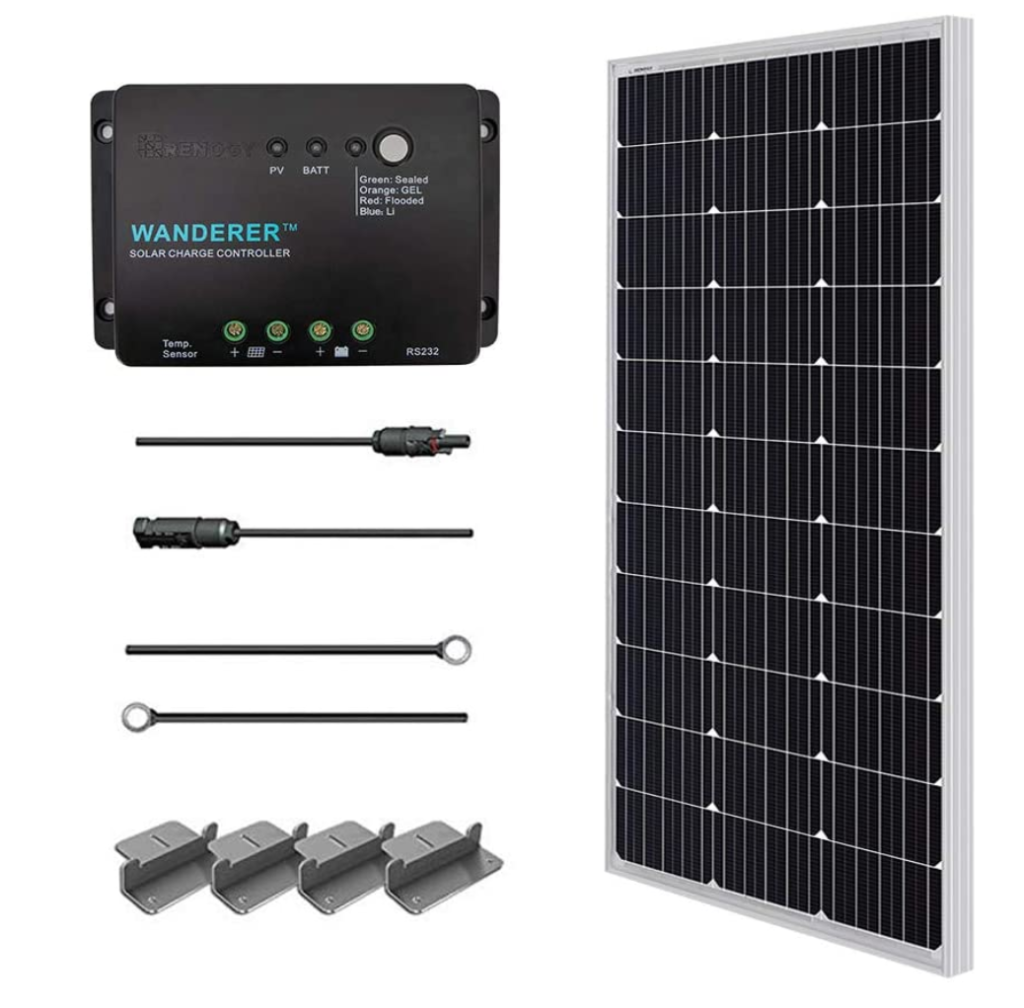
Back in 2015, I became interested in solar energy and purchased a simple kit to be able to store electricity generated from a solar panel. The basic items of this kit are shown here with their corresponding prices as these prices are a component of how one must think about the cost of production and the items offer a concrete way to understand what is involved in a very basic method of production.
The two significant items in this kit are the 100 Watt solar panel and the charge controller. The value of this kit was $185 at the time of purchase. This 100 watt panel was supposedly capable of storing 500 watth (watt hours) per day under ideal conditions. Think of a 60 watt light bulb consuming 60 watts per hour as a way understand how much electricity it could generate. Ideal means best alignment with full sun. The charge controller protects the battery should the input of energy come too fast and should the battery reach capacity and the input need to be terminated.
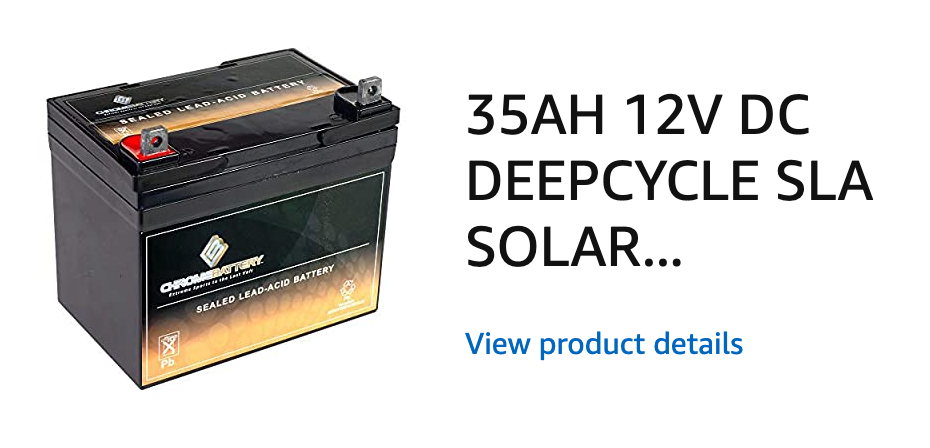
You can use power from a solar panel as it is generated, but typically the approach involves sending power from the panel to a battery and then drawing on the power from the battery as necessary. This is called a deep cycle battery and is designed to be charged and run down. There are many different ways to design batteries. A contrasting type might be designed to serve a function such as would be required in starting a car – big push, but most of the time not being drawn down. The cost of the battery was $75. If you are curious, the items described here might be the collection of resources someone would use to put together a system should they want to use a camper “off grid”.
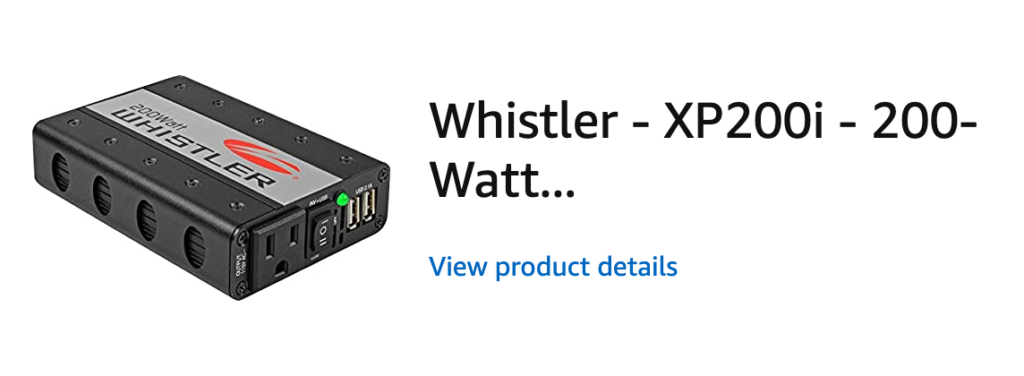
To power most electrical items we use, a 12 volt battery is not of much value. You need to convert the DC (direct current) output from a battery into AC (alternating current). The device to do this job is call an inverter. It is possible you have one in your car you might use (as a passenger) to plug your laptop in while someone else is driving. Cost of this inverter – $28.
So In 2015 I purchased this system capable of charging a battery and then powering low wattage devices for a total of $288. It was for experimenting, but I really never had a good place to use it. I set it up and knew it worked, but that was the end of the story.
Fast forward to the lock down required by the great pandemic of 2020. I am bored and need productive things to do. I decide to make use of my solar system and explore related issues.
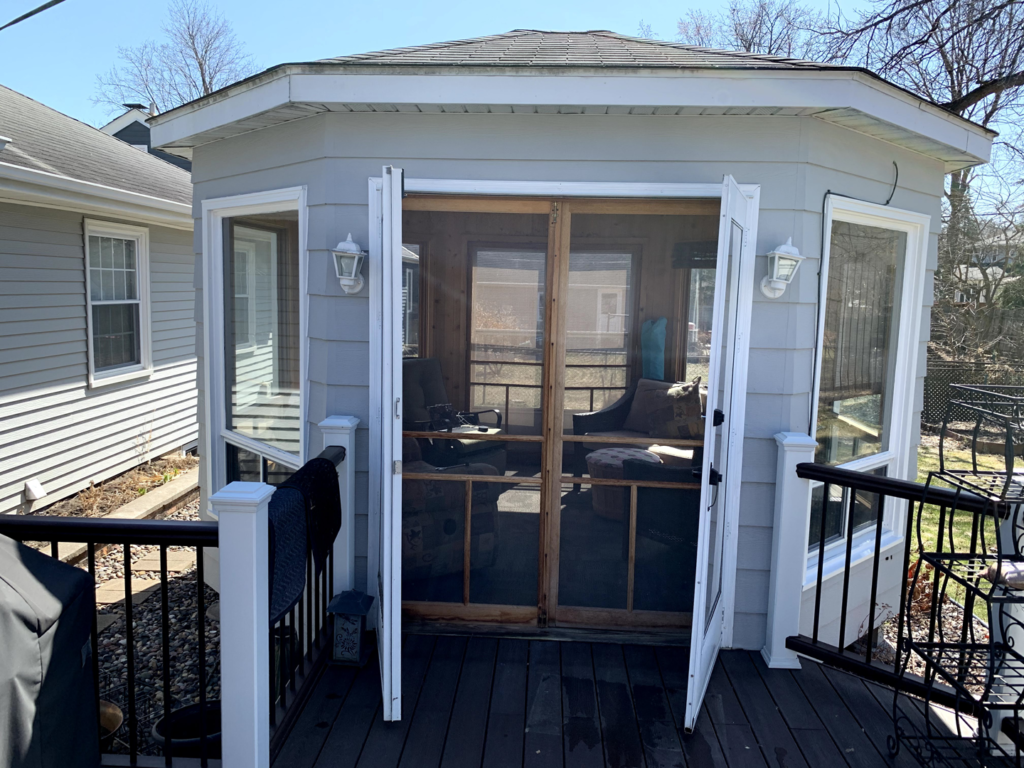
We have this gazebo in our backyard. It is a beautiful little building that is pretty much too hot to use in the summer because of all the windows and too cold to use in Minnesota winters. We are presently in early Spring and I decided given my circumstances of limited movement I would use the Gazebo as a reading/writing shack. I can usually get by without heat. I am running a space heater today because we just received about 6 inches of snow, but this is atypical. Why not explore the utility of the solar panel system?
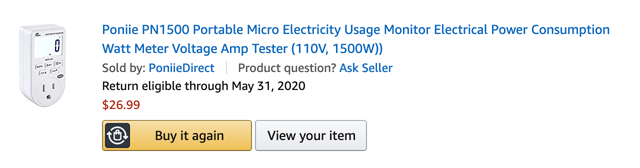
I needed one more tool to do the type of exploring that I thought might be useful. I purchased from Amazon (delivery right to your door even during the lock down) a usage monitor. This device is plugged into an outlet (from my DC/AC converter) and it then measures the power consumed when something is plugged into it. All kinds of data – volts, amps, watts, time power is being used, kwh (consumption in kilowatts).
Who buys these things? I am not certain. I think the idea is you use this device to try to understand what different devices might be contributing to your electricity bill and perhaps trying to decide if you should invest in a more efficient version of something you already use if it is very inefficient. I have a completely different agenda for this device. What a great learning through authentic investigation opportunity. There are plenty of things you can measure to understand power consumption and really appreciate things like the formula – watts = amps x volts.
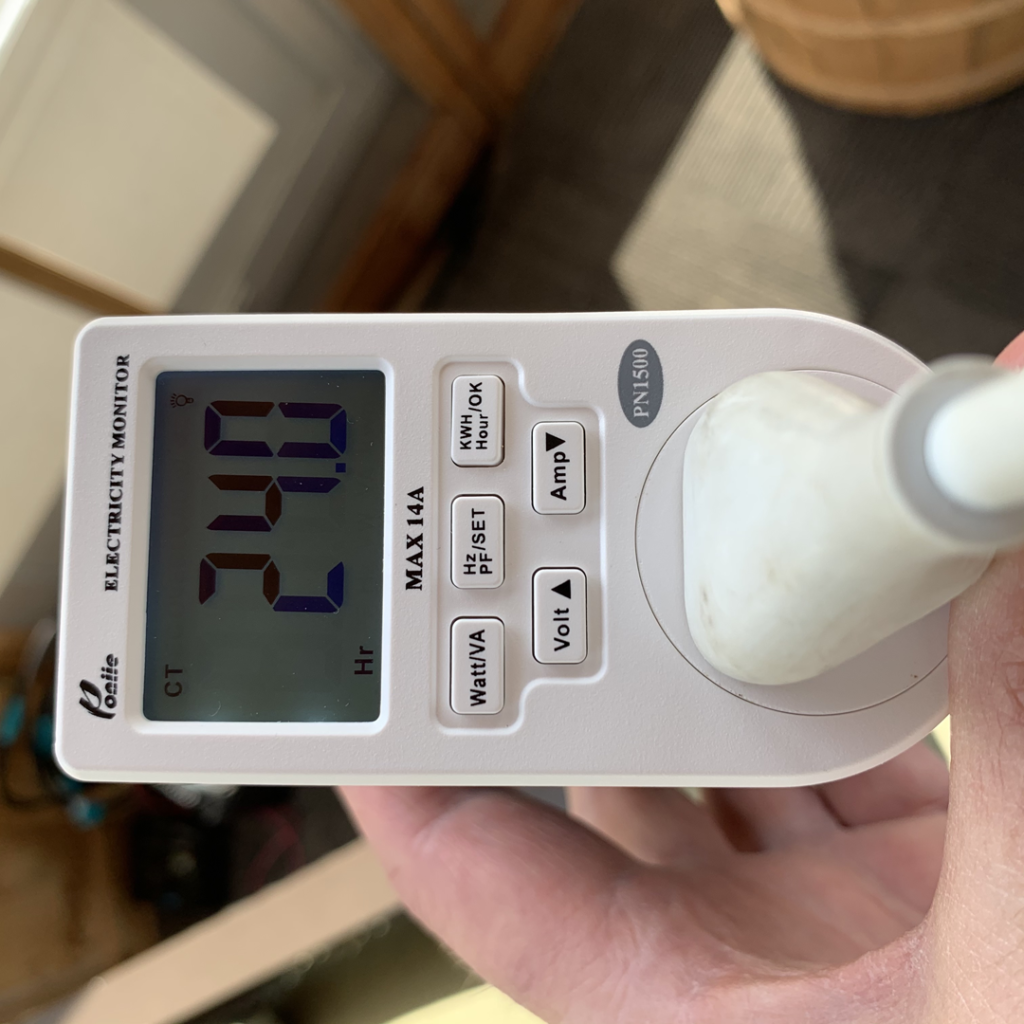
So, for example, if I can actually measure the three variables in this formula independently, I should be able to see if the formula really works. This device should let me do this. I am using my MacBook pro connected to my solar system through my power consumption meter. The read outs are as follows:
.28 amps
35 watts
124 volts
The values jump around constantly so there is a slight delay as I switch the monitoring device from variable to variable. You can take any two variables and plug them in to the formula watts=amps x volts to predict the third variable and you should see that things come out pretty close.
What I was really interested in was how much did I save running my solar system while I worked in the gazebo. I can plug multiple devices into my solar system, but the monitoring device only allows me to measure the power used by one at a time. I ran multiple devices through the system during the week – mostly my laptop, but also my iPad and my Echo (for music).
My idea was to use the rate provided by more power company to see how much money I had saved.
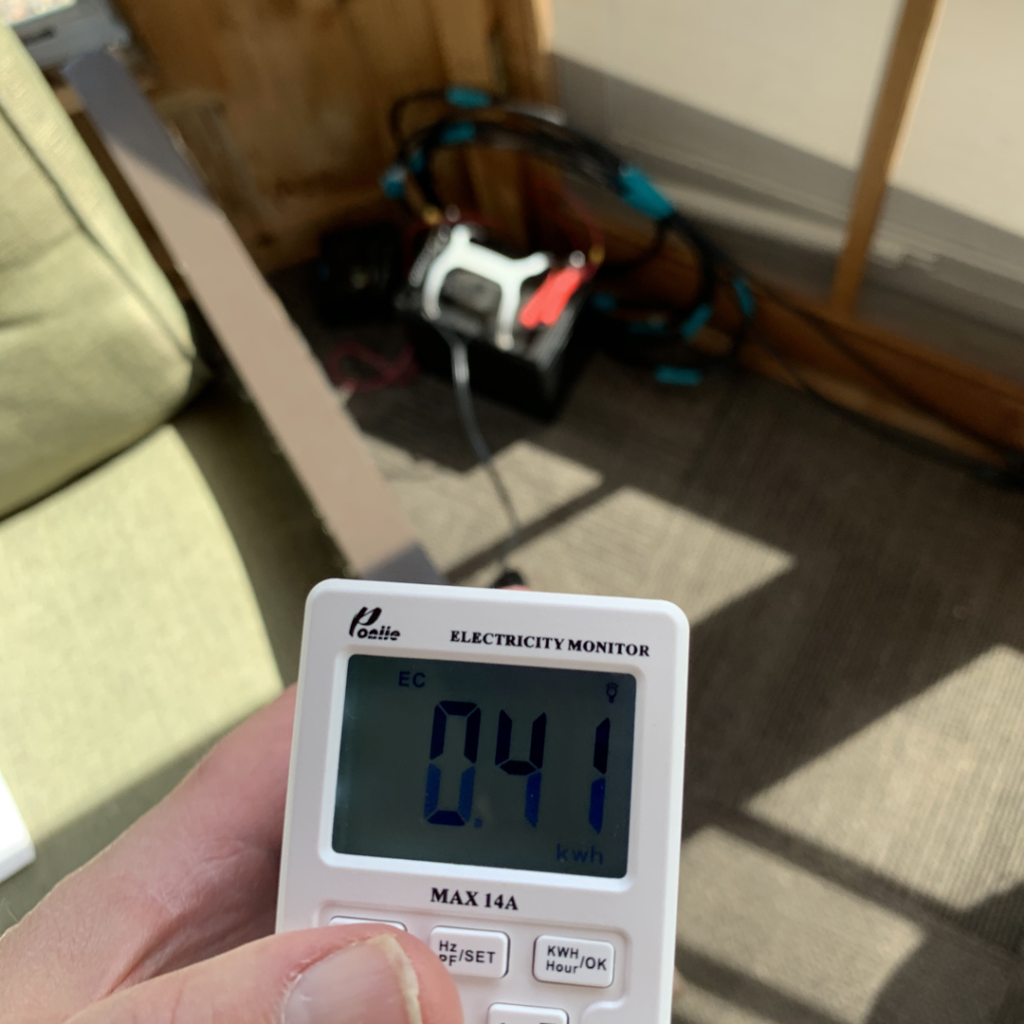
So, the following two values were generated by my monitoring device.
So, in the past week, I spent 24 hours plugged into the solar system in my gazebo. Curiously, the hours came out to exactly a day. I used .41 kilowatts of electricity during that time. .41 x .088 equals about 4 cents. Given my up front cost was $288, four cents does not seem like much.
I found a site that allows you to estimate the cost to use different devices and a laptop was among the devices included. This site used 60 watts as the power consumption of a laptop (I measured my laptop at 35 watts an hour or so ago). My laptop was not doing anything other than powering the screen at the time. I have not compared the load when say I was watching on online video or something that would place a load on the machine. If I use the value from the site instead of my actual total and assume that the ipad and Echo would draw the same as my laptop, I now estimate my cost savings would have been about 16 cents. This result seems very different and I am going to have to collect some more data and do a better job of controlling the variable I ignored (the load required for the different devices) to see if I can come up with something closer to what the online site suggested.
So, this is real research and it is messy. This is why research invests so much time in replication and careful methodology. Perhaps my case for educational applications would have been more persuasive had I not shared my actual data and the confusion these data have generated. Still, I decided this would be the wrong message. I conducted research and published scientific papers for a living (having nothing to do with electricity or solar energy) and I decided no, the messiness of science is part of the experience. I am trying to make the case for learning about data collection, methodology, and analysis as important educational goals. The messiness and the confusion caused by different ways of operationalizing questions and interpreting data are part of the process. I decided this is real science and this is what students need to experience in appreciating the process.
Educators, the power consumption meter was $26. What real questions about power and power consumption could your students ask and answer with this device.
I have taken considerable liberty in describing the mathematics, physics, and engineering involved in collecting, storing, and using energy captured from the sun. The simple system I have described could be constructed using a wide variety of alternatives for each of the devices and these devices interact in complex ways to influence efficiency and longevity. In addition, systems that use multiple panels, multiple batteries, and connecting solar systems to the existing electrical grid add complexity that could be considered. A reasonable source should you be interested in these issues – Build your own low-budget solar system.
First, data is plural [when it refers to information and not used as an example of a word]. It is the version of datum used to indicate more than one datum. It is difficult to keep that straight as it is so often used incorrectly that many have given up asking for a correction. Data as a singular noun even sounds right. I try to be careful, but no one corrects me any more. Try submitting a research manuscript though claiming “the data is ….” and you will be notified.
So, this my first effort to bring the attention of educators and those who try to focus what educators do on the importance of student experience developing expertise in data collection (methodology) and interpretation. My interest is in the absence of such experiences and the personal belief that the development of data-related collection and analysis skills is more important than other semi-important initiatives such as the focus on coding and computational thinking. I have yet to come up with catchy one or two-word description of the capabilities and dispositions I am focusing on. Data literacy is close and would work, but is already taken and it tends to be defined in a way that is too narrow. The existing use of data literacy is too focused on numerical data and other important categories of data (by my way of thinking) exist,
The collection of data can lead to thinking which I think is key to learning. Thinking does not necessarily have to follow data access, but thinking as an educational task is a matter of taking the opportunities that are there.
I have a record of a very high proportion of the songs I have listened to since 2006. The total number of songs at the start of the time I was writing this was 280,063, but it will be different by the time I am finished because I almost always have music playing in the background when I work. [Remember this comment because it is a clue to something I will ask of you later.] The number 280,063 is potentially interesting because it may indicate something about me relative to you. I may be a bigger music fan than you and maybe not. The number alone hides other interesting data. 280,063 is a statistic that summarizes something about the data. The data in the rawest form consist of a list of song/artist titles. A very long list. Each item on this list is connected with a time and date (when does he and did he listen) and has been categorized by the company responsible for the service by genre (has this old guy’s tastes changed over the years). BTW – the service I use is called Last.FM and the process of sending a signal from the multiple digital devices I use to listen to music to the giant database maintained by the service is called scrobbling. I can’t scrobble when I listen to the radio in my truck or when some member of my family uses the Amazon Echo. But when I am listening to music I select, I am nearly always using a phone, tablet, ipod, ipad, or computer. For those who have now returned to listening to music recorded on records, I get you, but aside from the hiss I think your claim to authenticity is bogus. Authenticity changes with the times. You aren’t listening to piano rolls are you? I admit the general digital-oriented basis for my existence is also somewhat uncommon, but I am what I am.
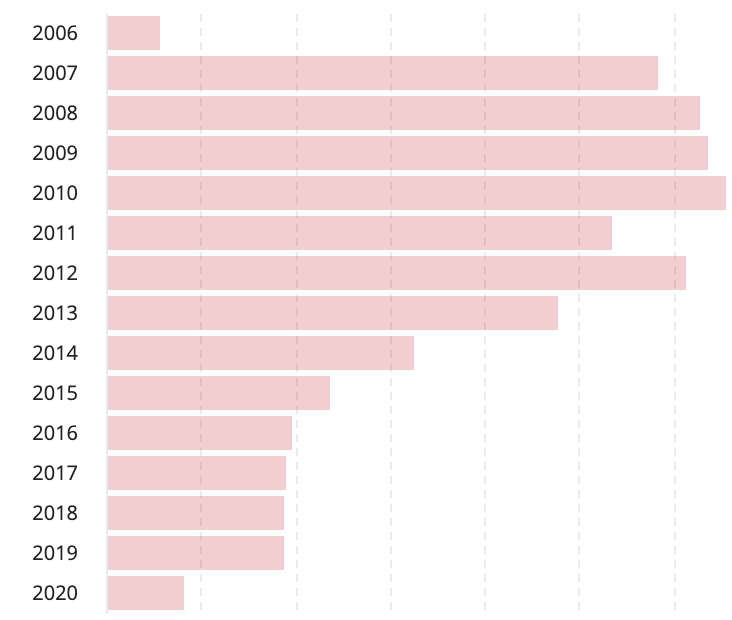
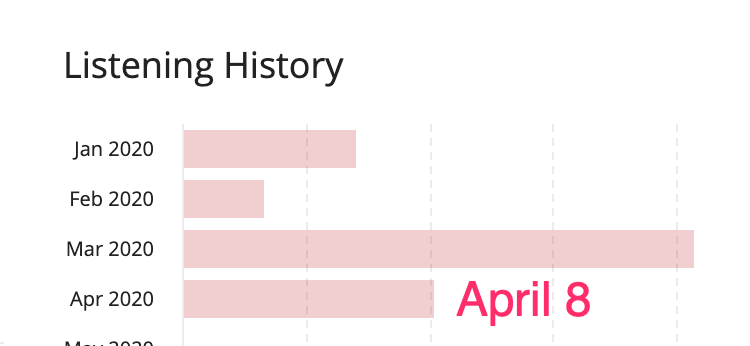
Just for kicks, I want to show you two charts that summarize these data and because of the trends that are evident ask for an explanation. I will refer to these summary representations as graph A and graph B. I think they show the same thing even though they seem to be moving in opposite directions. The first is the number of songs heard by year and the second the number of songs heard in recent months.
These bar graphs use one form of data to demonstrate something interesting about my life [see the clue I warned you about in one of the first paragraphs]. I obviously know things about my life you don’t and what I know brings meaning to these representations.
Some things I know: I work a lot and when I work I most frequently am reading, writing, coding, etc. using a computer. I retired a few years ago [graph A]. All of our lives have changed recently and we are spending most of our time now isolated in our homes [graph B] finding things to do that are somewhat defined by this reality.
Some reference points. In 2010, I listened to 32,728 songs. In Mar 2020, I listened to 2072 songs and 1226 songs through the first 8 days of April. The average length of a song is between 3-5 minutes, but varies significantly with genre. I suppose this fact is somehow useful in interpretation, but even 3 vs 5 is a large difference when you multiple the limits by 320,000 or so.
I wonder if these data say anything about my psychological state. I listen to a lot of blues, but blues for me is a happy genre. I listen to classical when I am in a somber mood.
Lifetime top artist – Miles Davis – 3919 listens
List 365 days – Bob Marley – 116 plays
Manage Consent
To provide the best experiences, we use technologies like cookies to store and/or access device information. Consenting to these technologies will allow us to process data such as browsing behavior or unique IDs on this site. Not consenting or withdrawing consent, may adversely affect certain features and functions.
Functional
Always active
The technical storage or access is strictly necessary for the legitimate purpose of enabling the use of a specific service explicitly requested by the subscriber or user, or for the sole purpose of carrying out the transmission of a communication over an electronic communications network.
Preferences
The technical storage or access is necessary for the legitimate purpose of storing preferences that are not requested by the subscriber or user.
Statistics
The technical storage or access that is used exclusively for statistical purposes.The technical storage or access that is used exclusively for anonymous statistical purposes. Without a subpoena, voluntary compliance on the part of your Internet Service Provider, or additional records from a third party, information stored or retrieved for this purpose alone cannot usually be used to identify you.
Marketing
The technical storage or access is required to create user profiles to send advertising, or to track the user on a website or across several websites for similar marketing purposes.


You must be logged in to post a comment.