This is a continuation of my previous post explaining how data generated by the Ambient Weather station can be exported and used in data literacy projects.
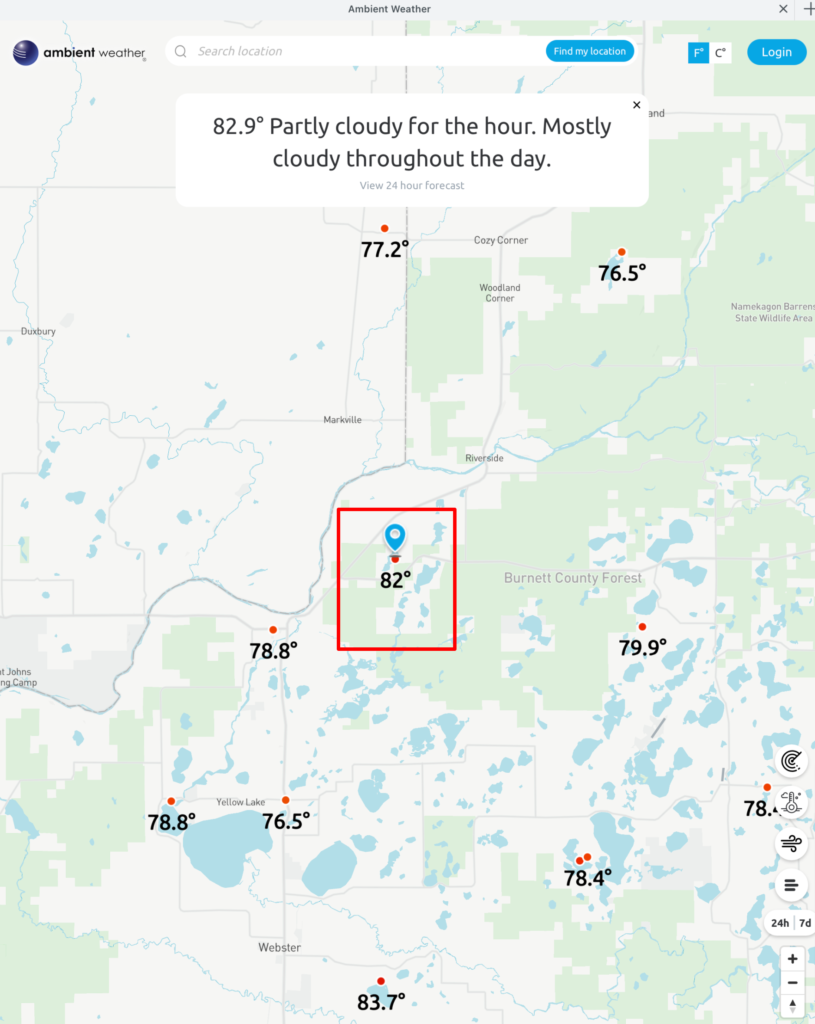
If the owner of the personal weather station I describe in my previous post is interested, you can add the feed from your station into multiple weather aggregation sites – see the following image (our site is identified by the red box).
Clicking on any of the comparable weather stations identified in this map allows access to the data collected by that station. I am proposing that installing such a station and becoming part of this network would provide the possibility for various data literacy projects for schools AND be a way to study the science of weather.
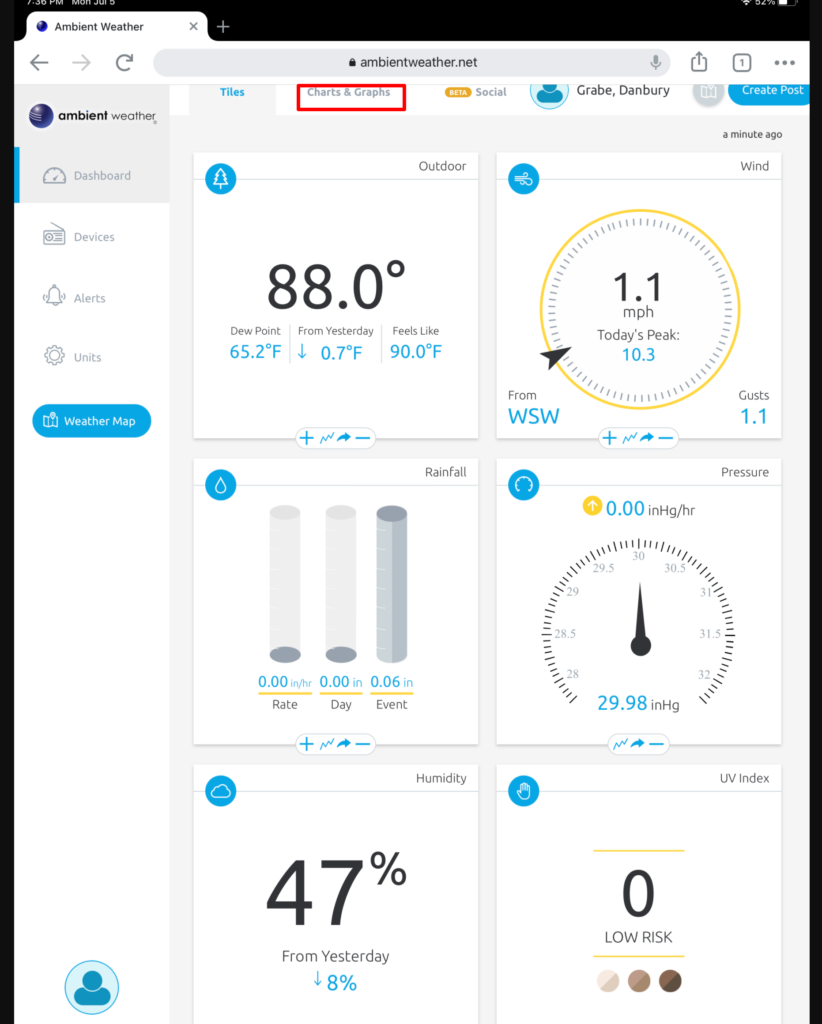
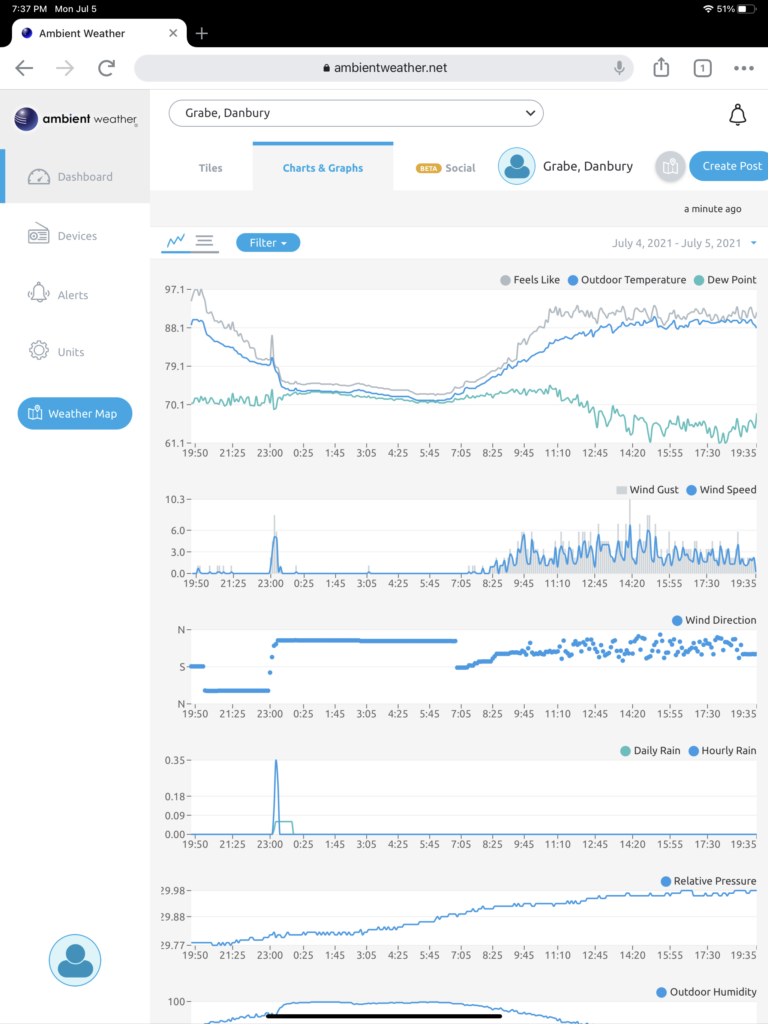
The Charts and Graphs link from this display (see red box) allows access to the data.
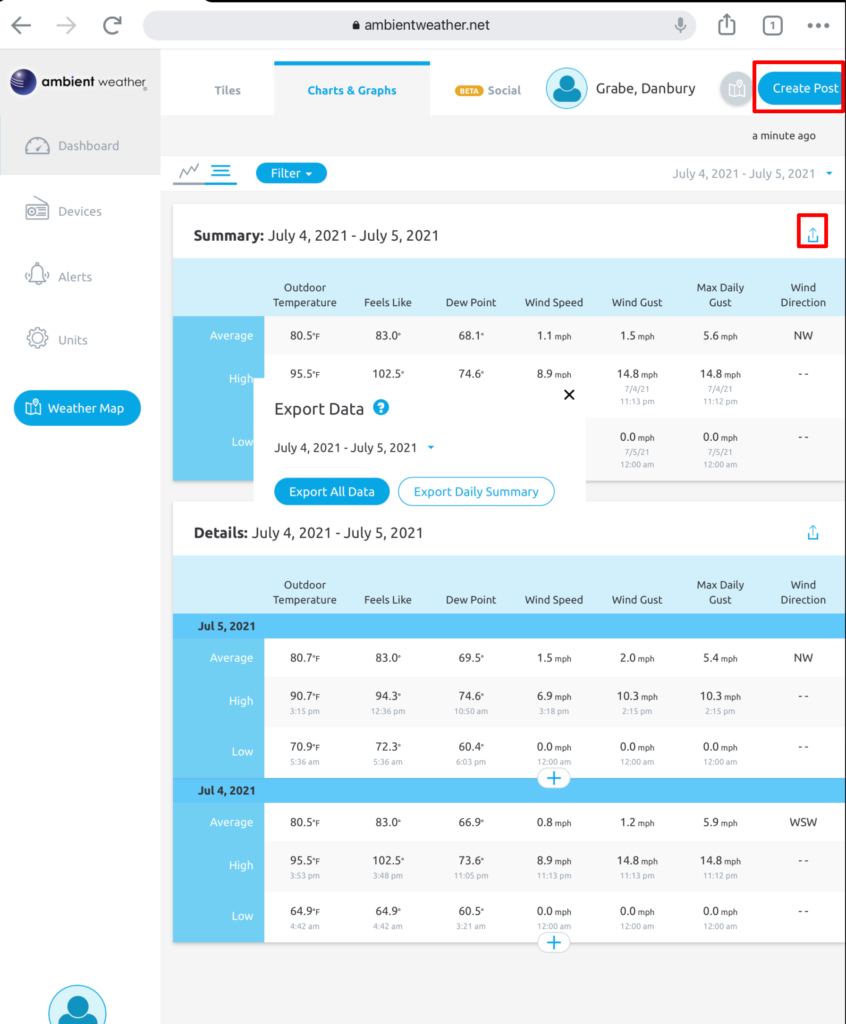
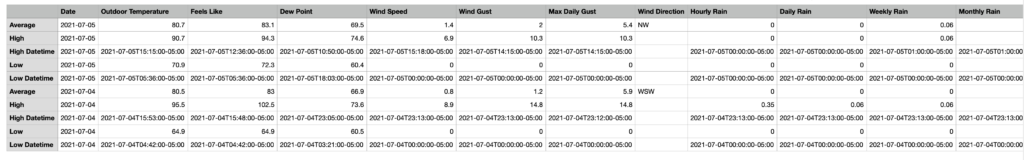
The data generating these graphs can be exported. Two features are identified in the following image – the download button and the opportunity to offer a post to the network (images, descriptions of weather events, etc.)
The data comes to your computer as a CSV file that can be opened in any spreadsheet for manipulation or integration with other data sources.
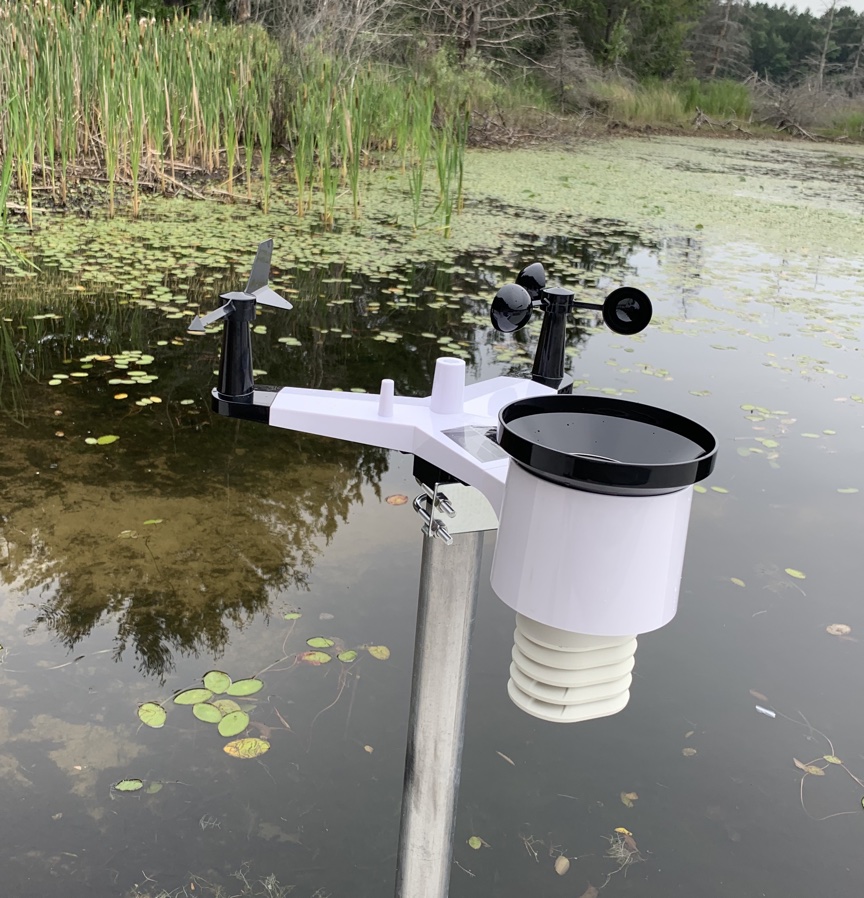
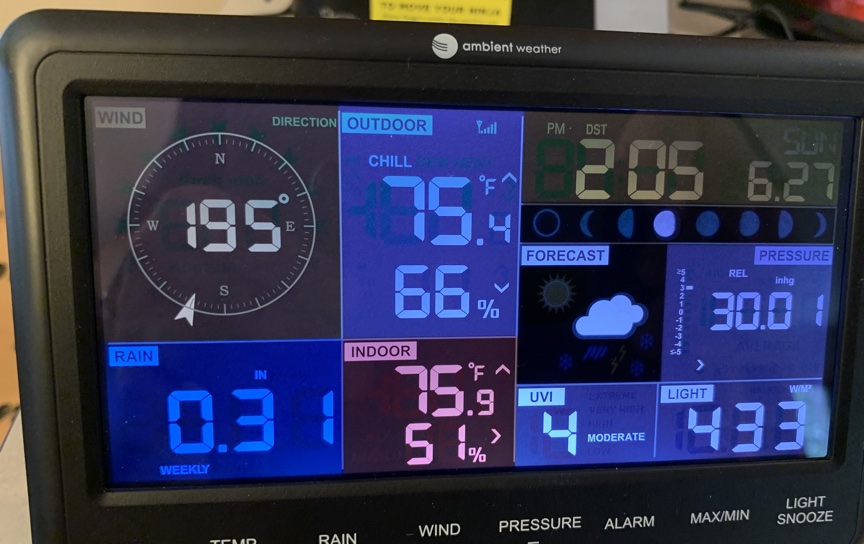
Amazon Prime Day got me again. I found this weather station (Ambient Weather WS-2902C WiFi Smart Weather Station) for $10 off (I think). What attracted me about this device was not so much the capacity to collect multiple weather variables that would appear on a local display, but the wifi connection available with this model. Owners of certain weather stations are part of a network of devices that allows the integration of data – kind of a citizen science concept (Ambientweather.net). I sometimes write about data literacy and the types of projects K12 educators might implement to collect and analyze data and this device at a reasonable price would work great for such projects.
I have encountered one challenge. I successfully assembled the weather station (not that difficult) and established a connection between the station and the local monitor. However, I did not read the product description carefully and missed the part about the 2.4GHz wifi router. My router operates at 5GHz and should be modifiable to also activate a 2.4 radio, but the online instructions for the model we have said this should be possible. However, the online product description doesn’t match what appears when I connect to the router. We have a web extender that offers both 2.4 and 5 channels, but mesh networks are not accepted by the Ambient product. I will have to discuss this inconsistency with technical support. The router is part of the modem we rent from our DSL provider so some additional research will be required.
I did get the feed working. Here is access to the data from my device as it is being collected.
This is an update on my personal solar energy exploration. When the weather was warmer I have used a solar panel to power much of the writing I did in a gazebo located next to our house. I explain the project in previous posts (description, power saved).
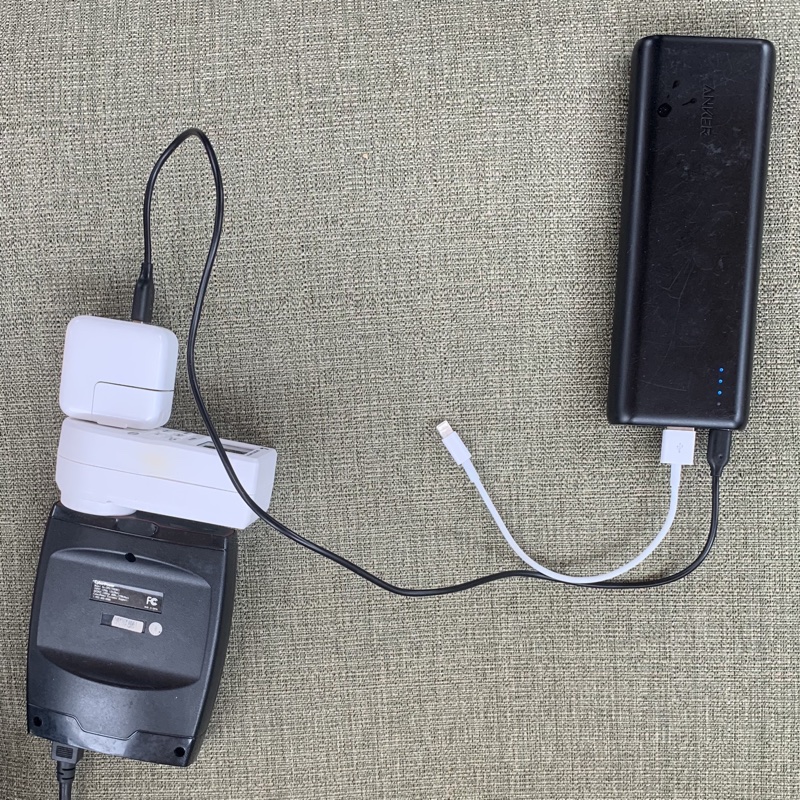
While it is now too cold for me to work outside without running a space heater. I decided that I could continue to use the solar panel and just transfer power to my devices using a portable battery pack. This is not a very efficient system, but it works and keeps the project going.
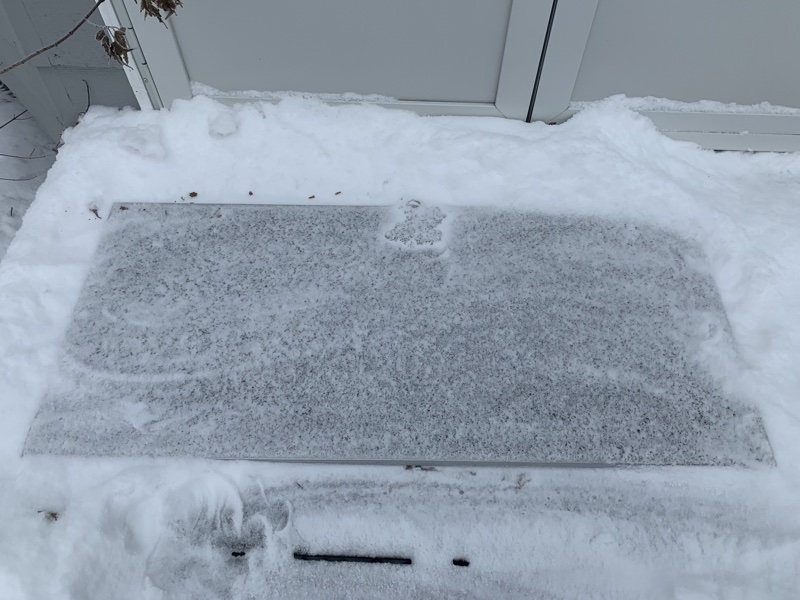
I have always wondered how those with solar power deal with the accumulation of snow on their roof panels. I can’t say I know, but the sun does penetrate a thin layer of ice. Laptops and tablets don’t use much power. There must be some variant of this setup that would make a great classroom project.
Back in April I started a project that I decided to conclude today. The project was an effort to experiment with solar energy and energy consumption. I promoted this project as an example of what educators might find a way to explore both electricity and clean energy.
Here is a brief overview. I have a gazebo outside my house and I like to read and write in this structure when the temperature in Minnesota permits. Some years ago I purchased a solar panel and the equipment necessary to save the power generated from this panel to a battery and convert the DC to AC for use. I did very little with the equipment, but in April I purchased a device allowing the recording of the amount of energy flowing through an outlet. I decided to make use of my solar equipment to power my laptop and Amazon Echo when spending time reading and writing in this gazebo. The details of the equipment are described in the initial post.
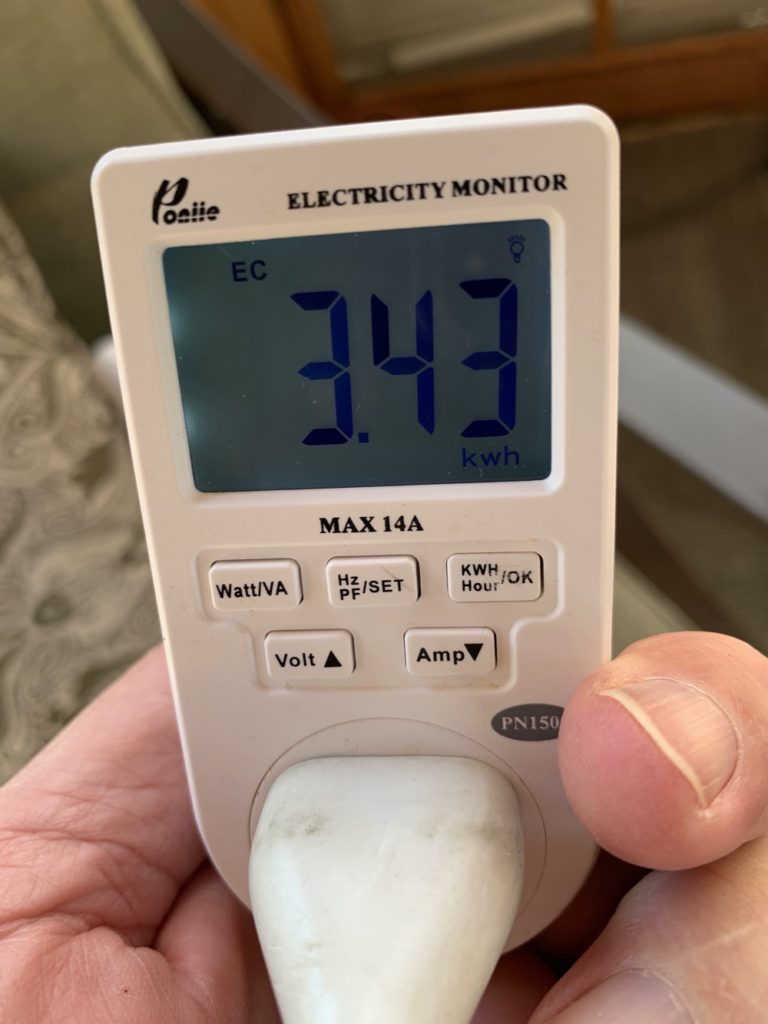
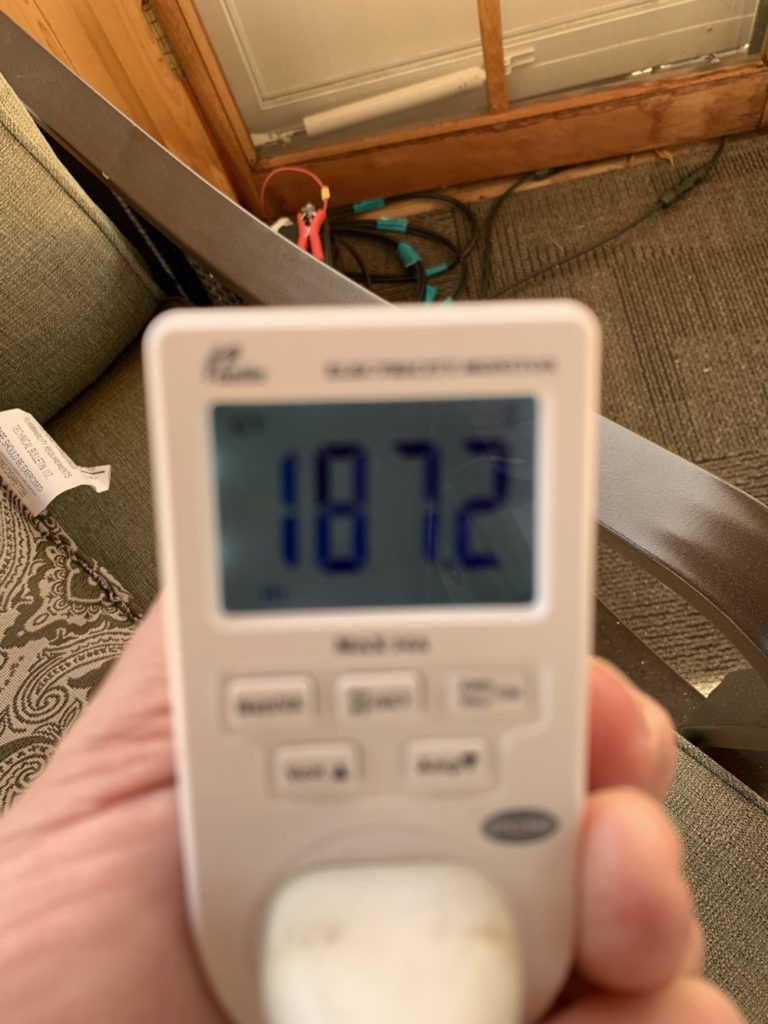
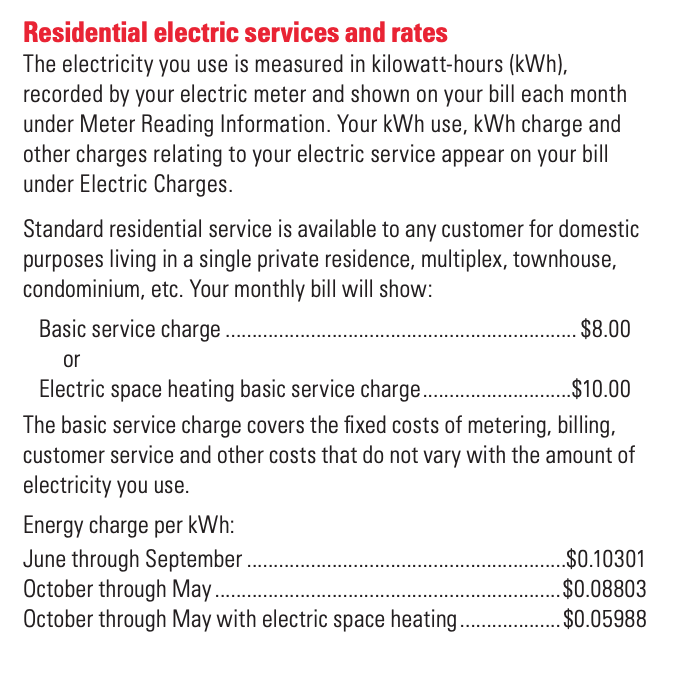
Today, I took the final readings to conclude the project. During the 187 hours I spent in the gazebo, I used 3.43 kilowatts of energy. The value of this electricity is about $.35. Laptops and the Echo are inexpensive to operate.
Those of us with programming experience are familiar with the concept of data types. When declaring a variable it might be necessary to declare the type of data that variable could hold, e.g., integer, string, floating point number, which in part determined how that variable could be used. This notion that data can take different forms allowing different types of manipulation might be useful to the notion of “methods for learning with data”. To me, this way of differentiating types of data suited to different purposes might be compared to the distinction some researchers make between quantitative and qualitative research. Some data questions cannot be addressed by the collection and analysis of data that can be expressed as a numerical value and exposure to the methods and analytical techniques associated with other data types offers insights into how certain types of questions can be addressed.
A good example of a nonquantitative approach can be found in the work of historians. What is it historians must do to collect and analyze data to offer descriptions of historical events and trends? What can historians do to be precise and accurate in their summarizations? How can historians offer a description of the process they have applied so that other historians can “check their work”? The techniques historians learn to accomplish these goals are often described as the historian’s craft. This collection of values and techniques has meaning for historians in much the same way that I as an experimental psychologist might point to courses in statistics and research methods as the basis for teaching and learning how questions are answered in my field.
There are ways in which students can have opportunities to explore components of the historian’s craft and be exposed to analytical methods of this type. For example, photographs represent a type of data historians might use to gain insight into historical events. Certainly, we all have viewed family photographs that offered a perspective on what life was like at a different point in time. How could many images be used to put together the “big picture” associated with some issue? Here are some useful resources offering suggestions for the use of photographs in this way.
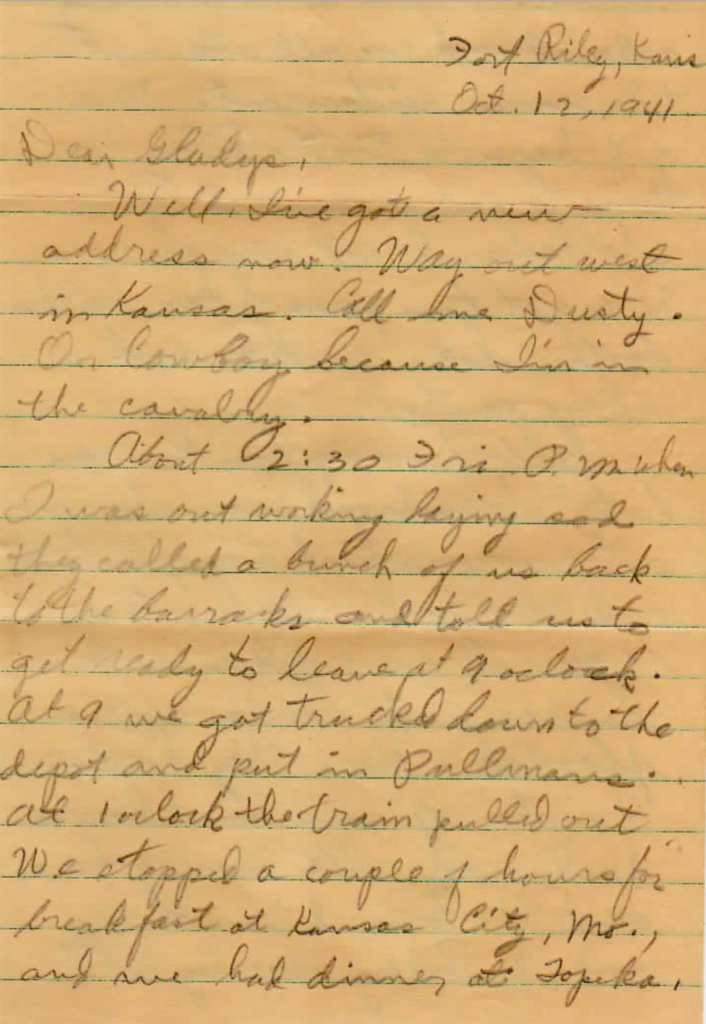
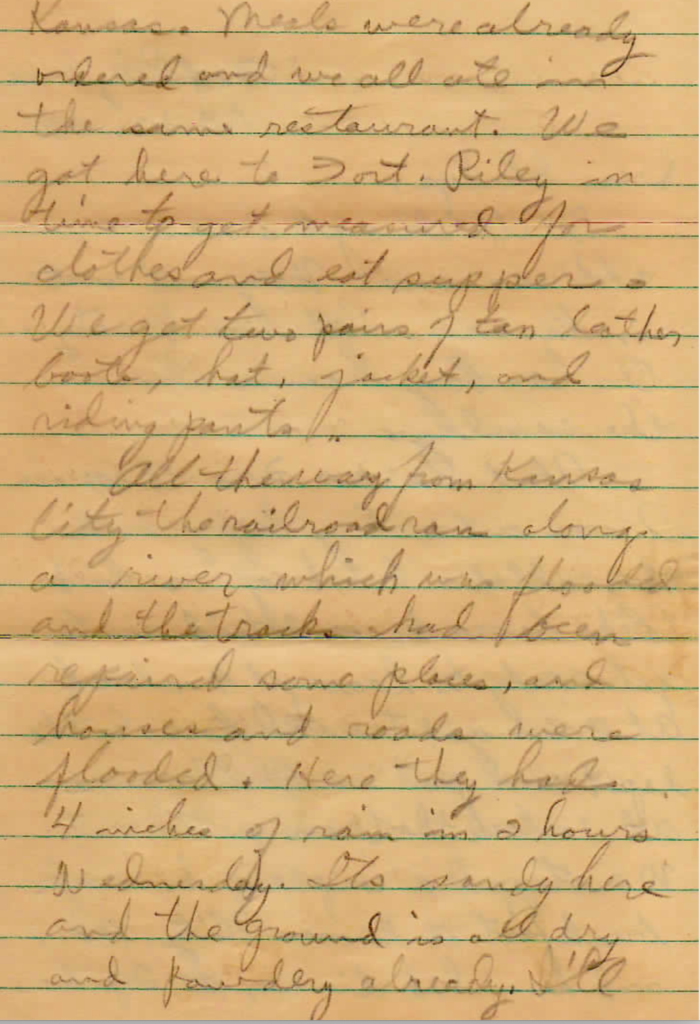
You never know when you could be in a position to apply the historian’s craft or engage your students in such methods of learning with data. We all have historical sources in our attics and other family storage sites. My brother recently began creating digital records of letters my father had sent home to his sister when heading off to fight in World War II. You wouldn’t know it from the sample I provide here, but he ended up in South Pacific as a radar operator. Making sense of letters and diaries
I started this series on the “methods of learning from data” (the phrase I have finally decided to use) because I thought K12 schools were missing an obvious opportunity. Partly, my motivation was prompted by the impact the coding advocates have achieved in gaining the support of the public and the interest of educators. The experiences of many students have changed as a consequence. While I value my own coding skills and the role the projects I have coded have played in my professional career, I still feel the broad role for coding some imagine lacks the evidence we should expect to make a drastic change beyond providing coding courses in high school. Put another way – computational thinking lacks credibility as a unique form of higher order thinking and I just don’t see the evidence that would warrant a drastic alteration of the curriculum. I think other tactics (e.g., writing across the curriculum) have demonstrated greater benefits in multiple content areas and other areas of emphasis (e.g., methods of learning from data) provide largely unexplored authentic activities for developing higher order thinking skills in multiple content areas.
As I have searched for similar positions, I found the data literacy emphasis that as far as I can tell was operationalized by library professionals. It seems to me that the big thinkers in the library community see the role of their profession more broadly than purchasing, recommending, and lending books and magazines. Librarians when describing the big picture suggest that they help others solve information problems. In developing the skills to accomplish this goal they might argue they help others become information problem solvers.
From this perspective, data literacy would represent an example of the development of the skills involved in solving problems based on the collection and analysis of data. What the methods of collection are will vary depending on the type of problem. What the data are will vary in the same way. The skills of analysis will be more consistent across both methods and data types.
I don’t think it is necessary for me to summarize the content from the Data Literacy Project. They have put considerable effort into both the background and the classroom suggestions. Here are several links you may want to explore.
Probes provide a way to collect information from the environment and summarize it numerically. You use a probe when you check someone’s temperature with a medical thermometer or a thermometer that reports the temperature outside of your window. Our textbook devotes considerable space to the classroom use of probes as allowing student participation in authentic activities. Probes were a category of digital tool we emphasized in our expansion of the core ideas we first found in Jonassen’s description of mindtools. We describe an authentic task as mimicking the behavior of practitioners. There is a theoretical explanation for the benefits of contextualizing learning through the use of authentic tasks, but this is type of thing I explain in our textbook and not here.
Probes play an essential role in most sciences and engineering and the data generated are important inputs to mathematical and statistical calculations. Probes have long been promoted for classroom use. I used to see multiple booths at education conferences displaying the probes companies had available and demonstrating some of the types of information these probes could collect. Student use of probes to conduct authentic investigations just seems such a logical fit with STEM initiatives and yet I don’t see the frequent use I expected when these devices first became available for classroom use. Again, probes represent another of the mysteries of why some ideas catch on in education and others do not.
My recent example of the multi-function power consumption monitor would be the last example of a probe I have used. Here is another example of a probe (heart rate monitor) that you may have used personally applied to a novel investigation. The links at the end of this example offer access to some of the companies providing probes for classroom use.
Probes = another opportunity for student data collection.
Manage Consent
To provide the best experiences, we use technologies like cookies to store and/or access device information. Consenting to these technologies will allow us to process data such as browsing behavior or unique IDs on this site. Not consenting or withdrawing consent, may adversely affect certain features and functions.
Functional
Always active
The technical storage or access is strictly necessary for the legitimate purpose of enabling the use of a specific service explicitly requested by the subscriber or user, or for the sole purpose of carrying out the transmission of a communication over an electronic communications network.
Preferences
The technical storage or access is necessary for the legitimate purpose of storing preferences that are not requested by the subscriber or user.
Statistics
The technical storage or access that is used exclusively for statistical purposes.The technical storage or access that is used exclusively for anonymous statistical purposes. Without a subpoena, voluntary compliance on the part of your Internet Service Provider, or additional records from a third party, information stored or retrieved for this purpose alone cannot usually be used to identify you.
Marketing
The technical storage or access is required to create user profiles to send advertising, or to track the user on a website or across several websites for similar marketing purposes.
You must be logged in to post a comment.