It is Citizen Science Month. For science educators there are opportunities to recognize the role of citizens in your community contributing to science and perhaps to start a project that allows students to contribute to science.
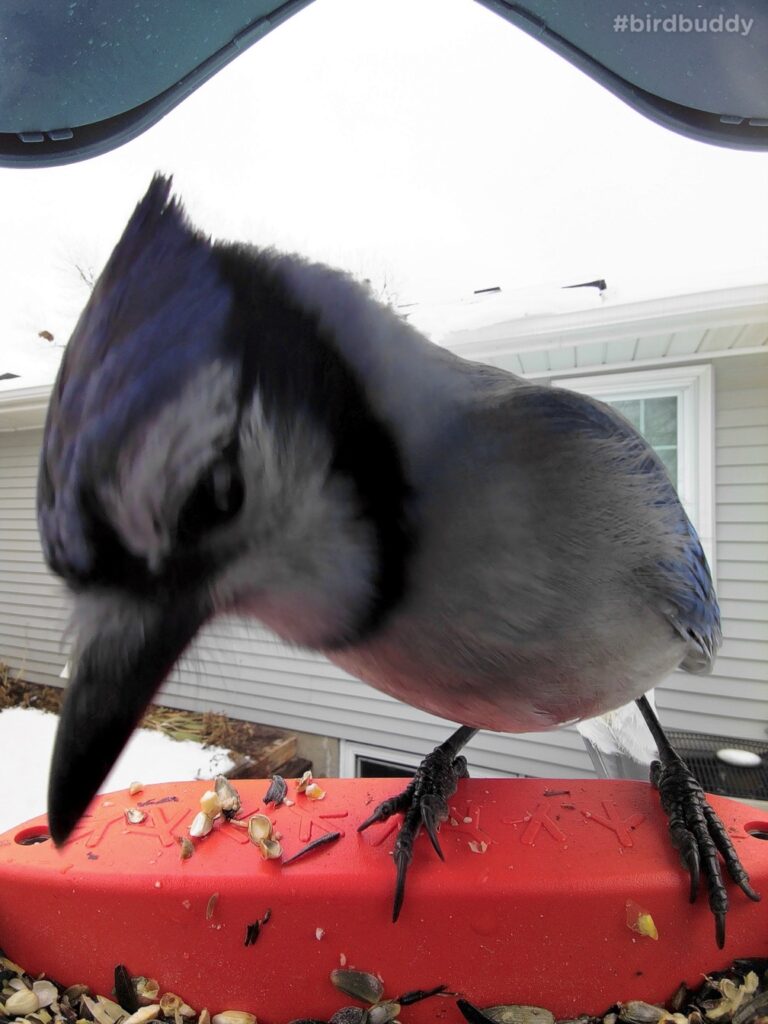
The Citizen Science website offers explanations and examples, but I have several of my own (personal weather station). Recently, I have exploring the potential of Bird Buddy. My wife became interested in this product as a Kick Starter project and invested. Bird Buddy is essentially a bird feeder that contains a motion activated camera. The feeder uses wifi to connect to your phone.
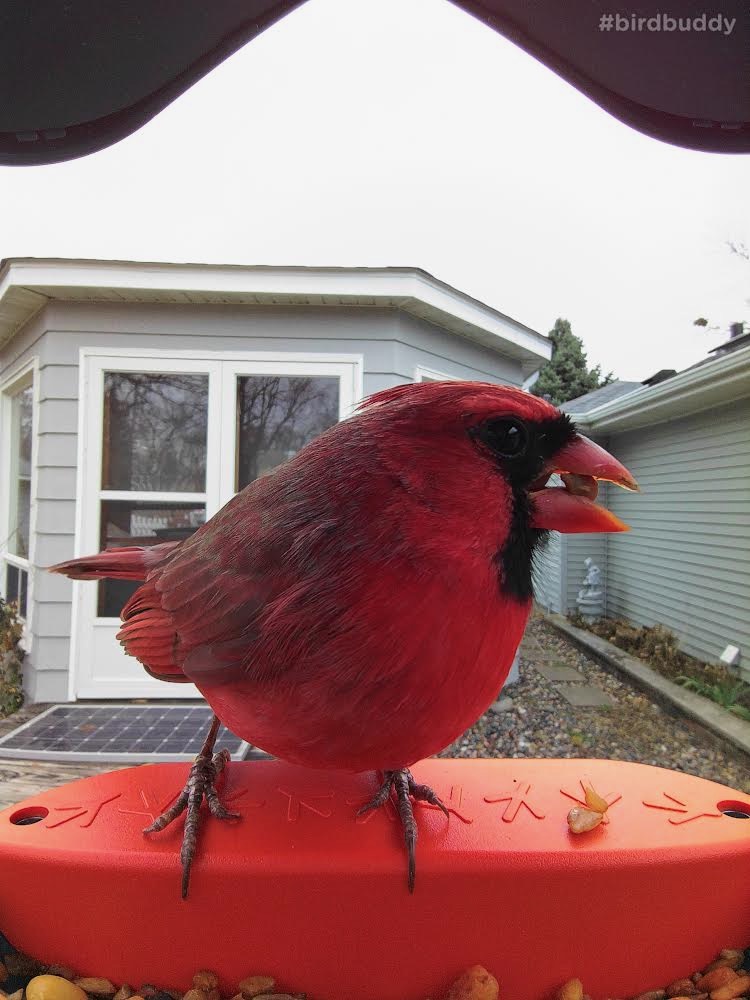
Images that are shared with you are also sent to Bird Buddy and the company uses AI to attempt to identify the birds in the images that you capture.
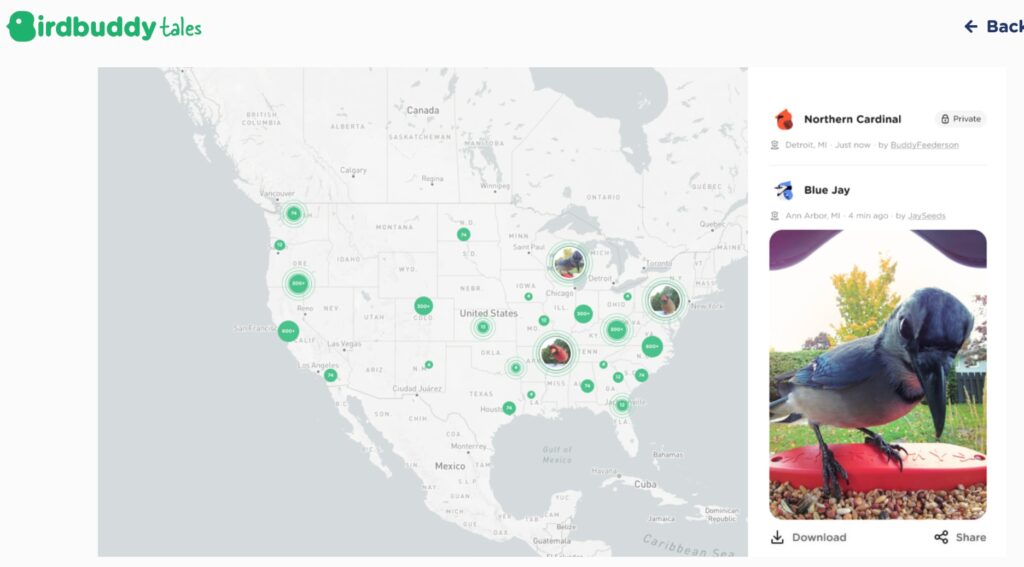
In addition, Bird Buddy has initiated a project called HeartBeat that collects information about the birds photographed in different areas of the world (the device is now being sold world wide). As a participant you can access these data and view some of the photos being captured world wide.
An interesting feature of BirdBuddy is that you share images you capture with others you designate. To my knowledge educators have not taken advantage of this opportunity, but it would be possible to collect data and share images with other classrooms.
I have been reading “From reopen to reinventing” because I know the author promotes mastery learning and I came across a section that talked about the reluctance to consider changing many components of the curriculum. The discussion used Algebra II as an example. The section of the book argued that the math sequence – algebra, geometry, algebra II, and pre-calc has become possibly the most static part of the curriculum despite the discouraging experience it provides so many students. On one hand, there is the increasing K12 emphasis on STEM and on the other the low number of graduates who claim they so seldom have use for any mathematical knowledge/procedures past what they learned in Algebra I.
The book made reference to a Freakonomics podcast (America’s math curriculum doesn’t add up) which is probably over the top, but very interesting and well worth a listen. The podcast contains some of the stats on the long-term application of math that Horn uses in his book. For example, the Center for Education and the Workforce contend that only 11% of U.S. jobs require knowledge of concepts taught in Algebra II and 6% advanced operations. I suppose the argument “who actually ever uses this information” can be made for many content areas, but it is the combination of the number of math courses expected, the frustration so many students have with this discipline, and the limited number of courses students take that make this an important issue. BTW – if you do listen to the podcast take a look at the comment section which contains counterarguments from math teachers and math advocates. The argument which I recognize from one other area with many advocates (computational thinking developed through coding) suggests a different value for math beyond a direct application in a vocation. Such courses encourage the development of higher order thinking skills.
As I have argued in my comments on the “coding for all” position, there are many ways to develop the components of problem-solving in many other disciplines and the extent to which problem-solving as a higher-order skill transfers from one domain to another cannot be assumed. It is far easier to develop problem-solving skills in the domain to which they are to be applied.
Horn makes a suggestion similar to the argument I have made several times in this blog. Statistics (I would argue it is more valuable to teach a course focused on both Statistics and Research Methods) as a math-oriented course teaching what I call data literacy. The use of data and the importance of interpreting and critiquing arguments made with data are so common it would seem familiarity with this topic is of greater value to more citizens and in more areas, than would be the case for advanced algebra concepts. Horn says the percentage of K12 students with some exposure to statistics is less than 20%.
So, I more and more see several of the math courses taught in K12 similar to the way I think about computer science courses in high school. These should be widely available as electives as both areas are essential for some students. Data literacy should be a topic widely integrated in multiple areas and statistics (and research methodology) should be as widely available as Algebra II.
Data literacy is one of the categories of posts I continue to develop. My initial exposure to data literacy came from a journal for school librarians. “Data literacy refers to the ability to understand, generate, and use data.” As schools continue to encounter recommendations for the development of skills students need to deal with the realities of the future (e.g., computational thinking), the case can be made that data literacy is as important as any other. The closest I can come to understanding what this means is based in my repeated exposure to statistics. It was an important part of my training as a psychologist, but working with data is common across so many areas and now with “big data” it seems the importance of thinking with data has only grown.
One of the interesting things about data is that it is so common and part of so many issues we encounter. The variety of situations in which understanding and using data is important offers both a challenge and an opportunity. The category of posts I have generated on data literacy offers what I hope are opportunities to encounter this variety. Here is another example that recently emerged from an unusual source.
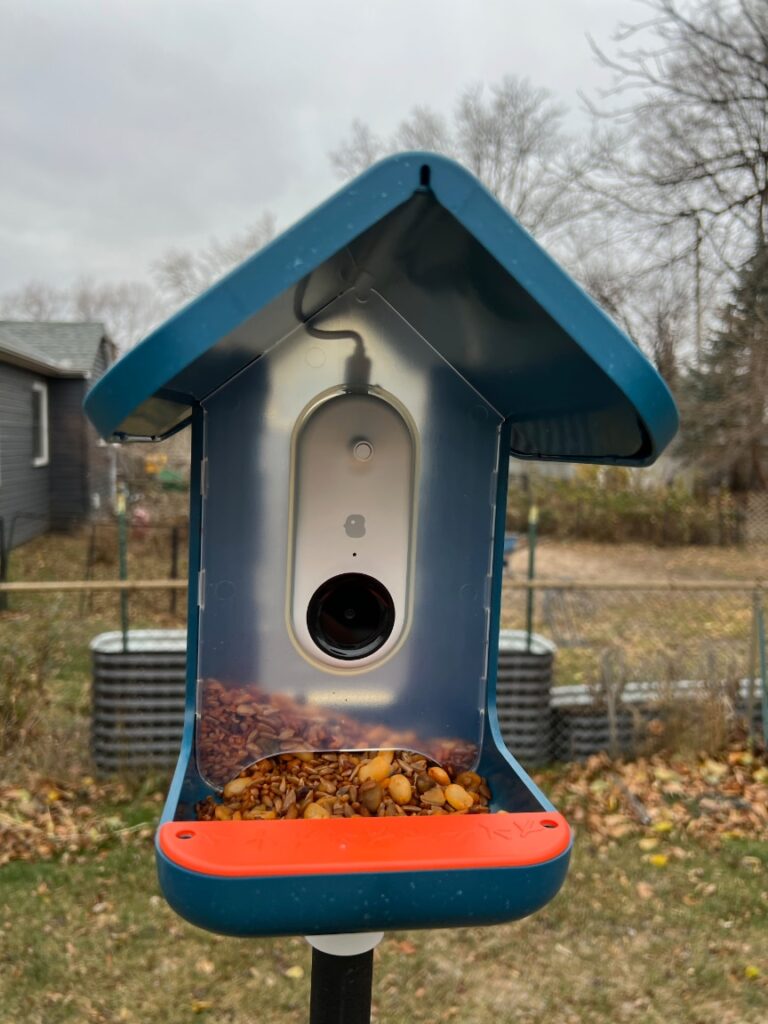
A few months ago my wife finally received the complimentary sample of an IndieGoGo project she had invested in. The product was Bird Buddy. I like to describe it as a bird feeder with an embedded motion-activated digital camera. In other words, it takes photos of birds that visit the feeder and sends them to your phone. Pretty cool.
My initial experiences with the Bird Buddy reminded me of a data literacy project I had imagined several years ago. I do feed birds and I do take pictures. I had a different setup for taking pictures of the birds that came to my feeders and I proposed science projects be based on data that could be generated from such setups. The idea was not original and related to citizen science projects I was aware of originating from the ornithology program at Cornell University.
The Bird Buddy people seem to have similar ideas and have taken advantage of their technology for capturing images and sharing these images digitally. My description of their process left out a few details. In their process, they make use of AI to identify the birds photographed and return the proposed identification to users. I say proposed because image identification is tricky and when uncertainty is clearly present the system proposes an identification and asks what the feeder owner thinks.
The key to the potential for data literacy projects here is that the data from thousands of these feeders gets routed through the company to take advantage of AI identification and the company has begun aggregating these data in a project they call the Heartbeat Project. Try this link. It shows confirmed identifications of birds on a map as submitted from all over the world. It is fun just to watch.
The company has started to do some simple analyses of these data and the first venture involved graphing the time of day with the greatest frequency of feeder visits. Simple, but you can begin to see the potential here. The variables are endless – region of world (down to a few yards), type of bird, time of year, time of day, etc., etc., etc. The company promises to share data with interested parties every few months.
I am hoping the company takes advantage of their data in the near future to offer opportunities to classrooms. It would be a great authentic data literacy experience to share feeder data with other schools and to propose questions the data might answer.
I encourage educators who see the potential here to keep an eye on this company and its product.
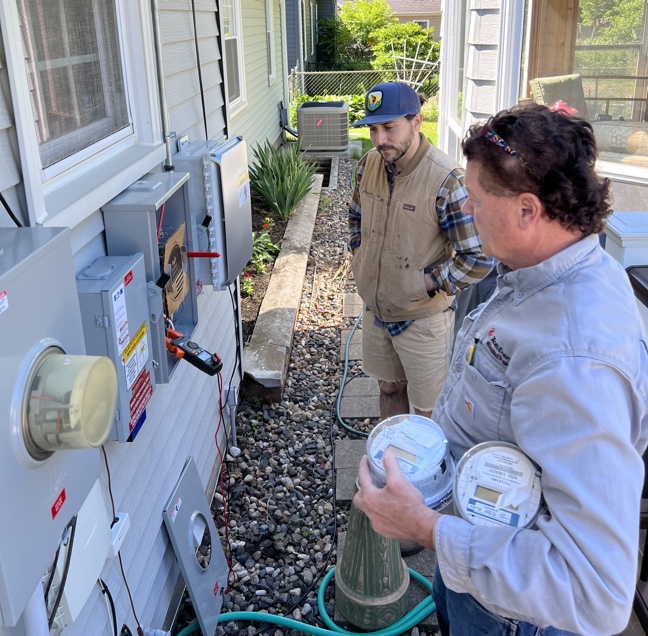
I have been interested in solar energy for some time. I explored solar energy production first with a single panel and a battery as a way to collect some data. We then made the commitment to install solar panels on our roof. This ended up being a multiple-year process as we first had to replace old shingles and then wait for the allocation of rebates to be renewed so we could save a bit on the cost. The process takes some time. First, there is the installation, multiple inspections, and finally the connection of your panels to the grid (if you are not using the panels to charge a giant battery). Different organizations are involved at each stage of the process.
Today was the big day. The power company came out and installed a new bi-direction meter (which tracks energy fed to the grid and from the grid) and a meter specific to our panels.
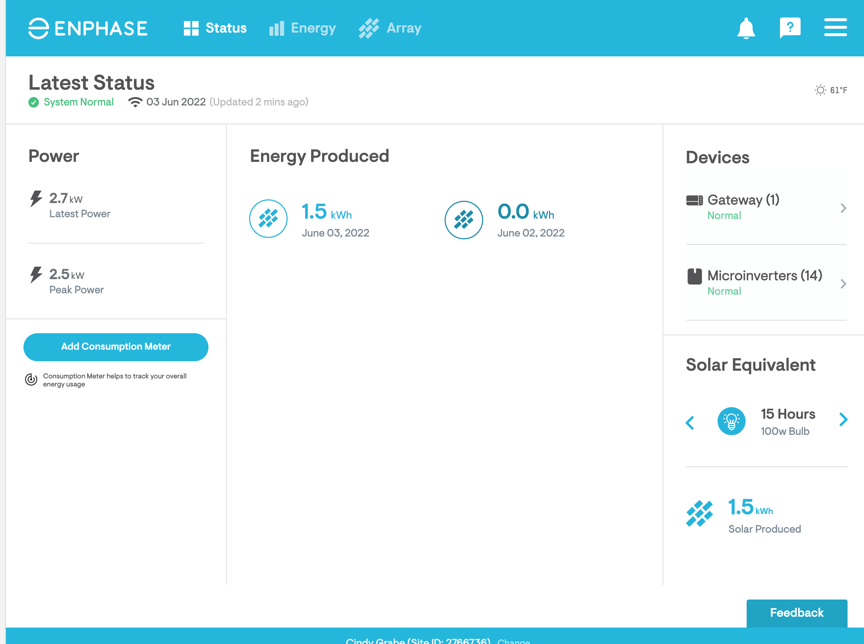
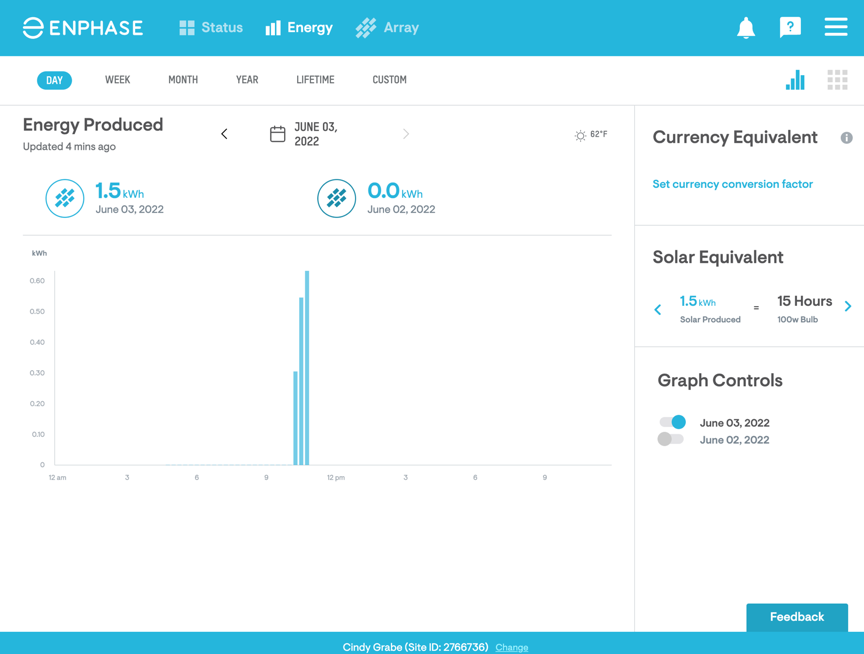
The system is connected to the Internet allowing the company who did the install to monitor whether everything is working. The same data are available to us. A couple of screens as examples follow. There is a feature that even explains how many hours the amount of energy you have produced could illuminate a 100 watt light bulb. For data geeks, this is just too much fun.
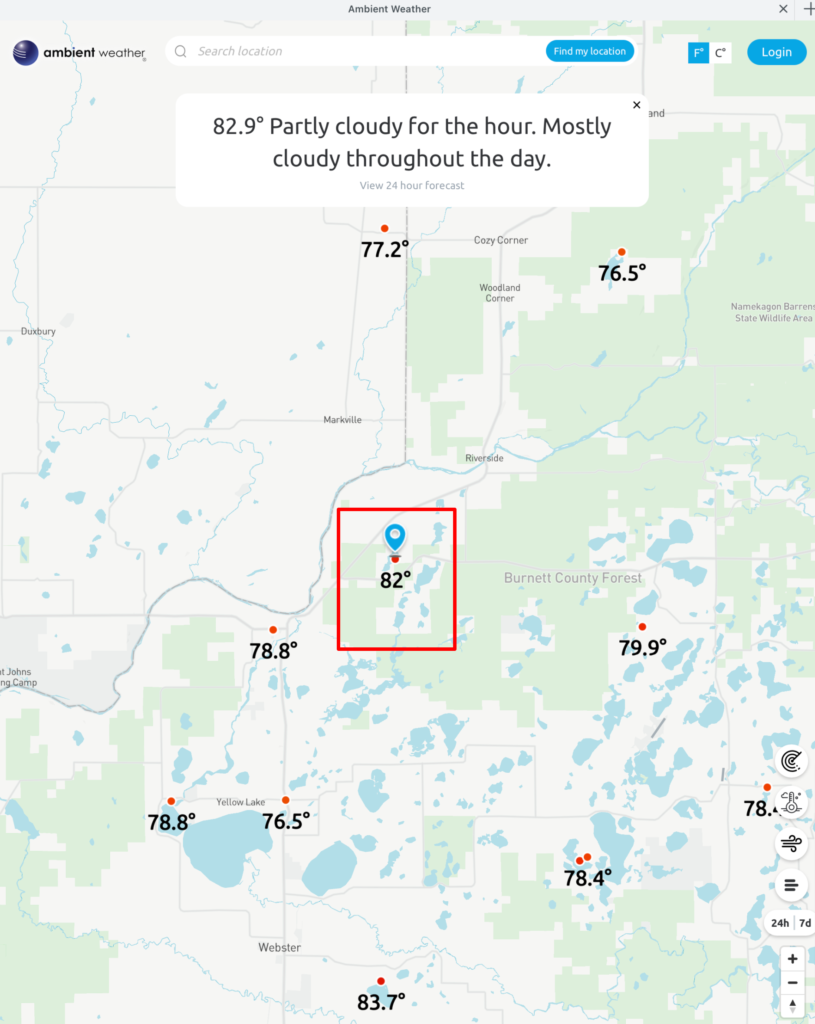
This is a continuation of my previous post explaining how data generated by the Ambient Weather station can be exported and used in data literacy projects.
If the owner of the personal weather station I describe in my previous post is interested, you can add the feed from your station into multiple weather aggregation sites – see the following image (our site is identified by the red box).
Clicking on any of the comparable weather stations identified in this map allows access to the data collected by that station. I am proposing that installing such a station and becoming part of this network would provide the possibility for various data literacy projects for schools AND be a way to study the science of weather.
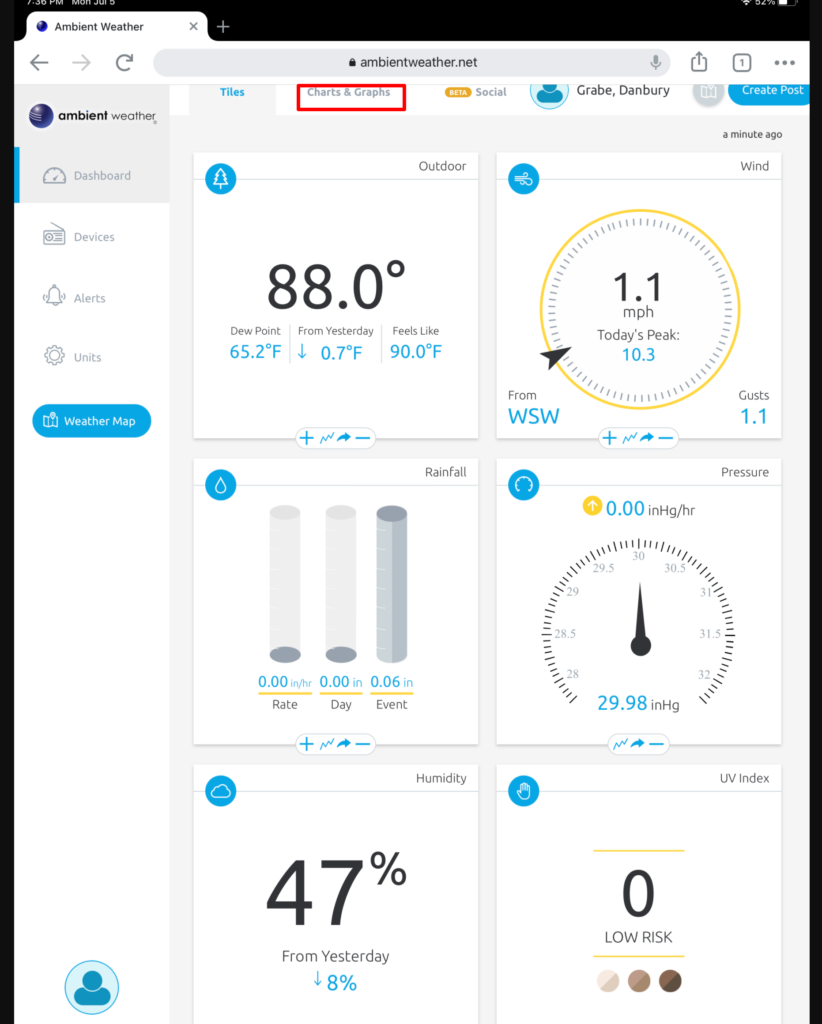
The Charts and Graphs link from this display (see red box) allows access to the data.
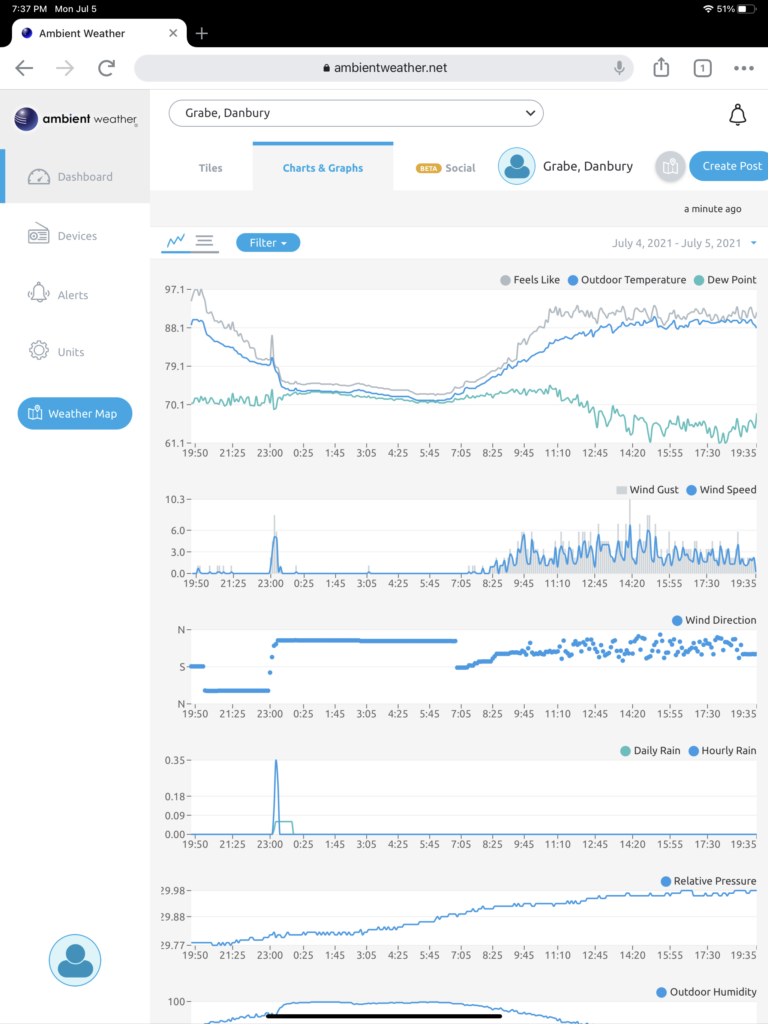
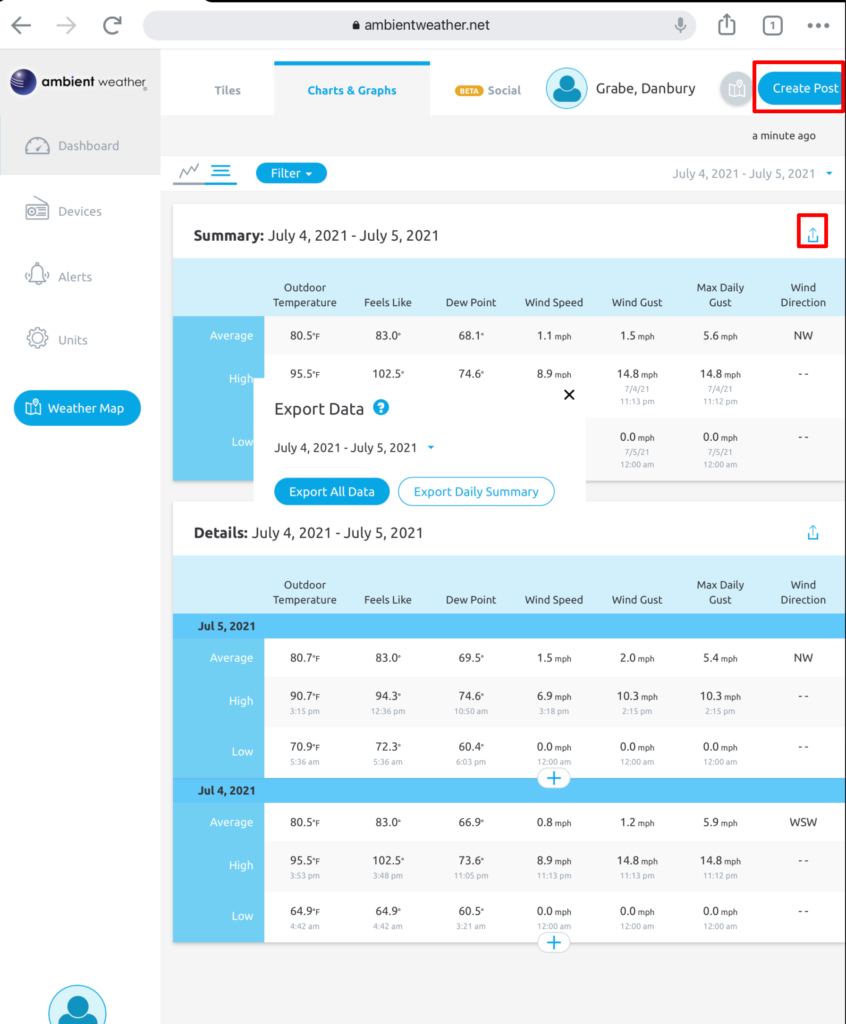
The data generating these graphs can be exported. Two features are identified in the following image – the download button and the opportunity to offer a post to the network (images, descriptions of weather events, etc.)
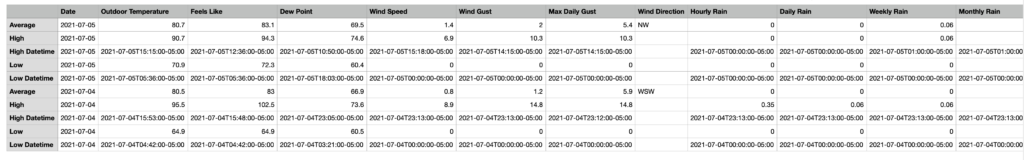
The data comes to your computer as a CSV file that can be opened in any spreadsheet for manipulation or integration with other data sources.
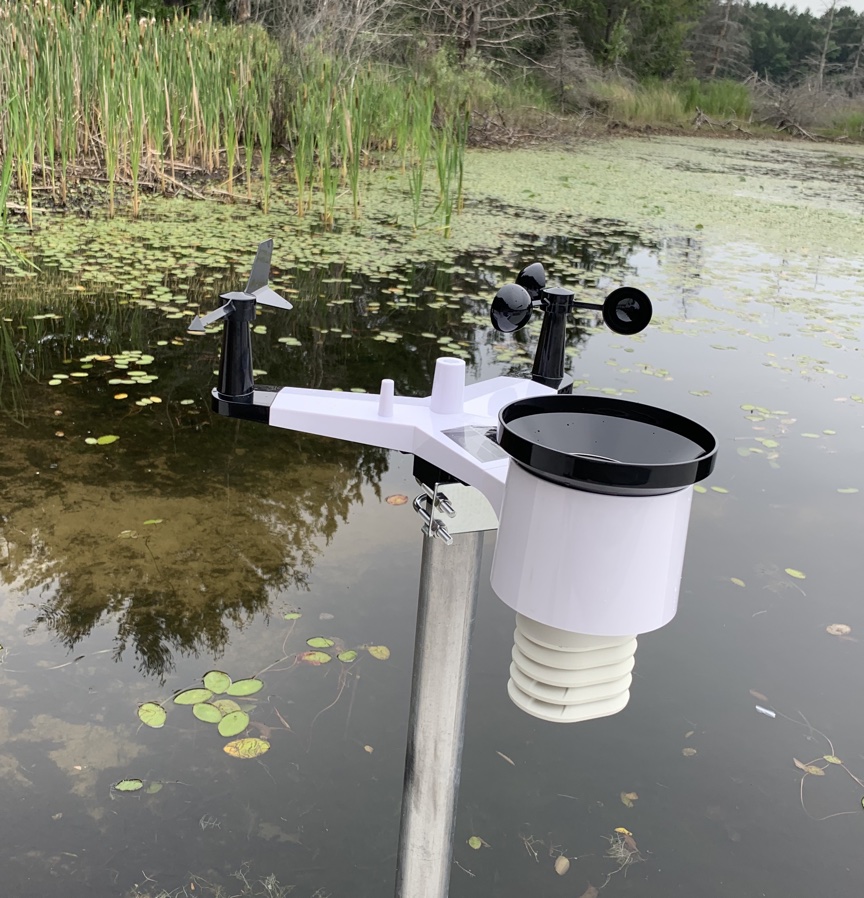
Amazon Prime Day got me again. I found this weather station (Ambient Weather WS-2902C WiFi Smart Weather Station) for $10 off (I think). What attracted me about this device was not so much the capacity to collect multiple weather variables that would appear on a local display, but the wifi connection available with this model. Owners of certain weather stations are part of a network of devices that allows the integration of data – kind of a citizen science concept (Ambientweather.net). I sometimes write about data literacy and the types of projects K12 educators might implement to collect and analyze data and this device at a reasonable price would work great for such projects.
I have encountered one challenge. I successfully assembled the weather station (not that difficult) and established a connection between the station and the local monitor. However, I did not read the product description carefully and missed the part about the 2.4GHz wifi router. My router operates at 5GHz and should be modifiable to also activate a 2.4 radio, but the online instructions for the model we have said this should be possible. However, the online product description doesn’t match what appears when I connect to the router. We have a web extender that offers both 2.4 and 5 channels, but mesh networks are not accepted by the Ambient product. I will have to discuss this inconsistency with technical support. The router is part of the modem we rent from our DSL provider so some additional research will be required.
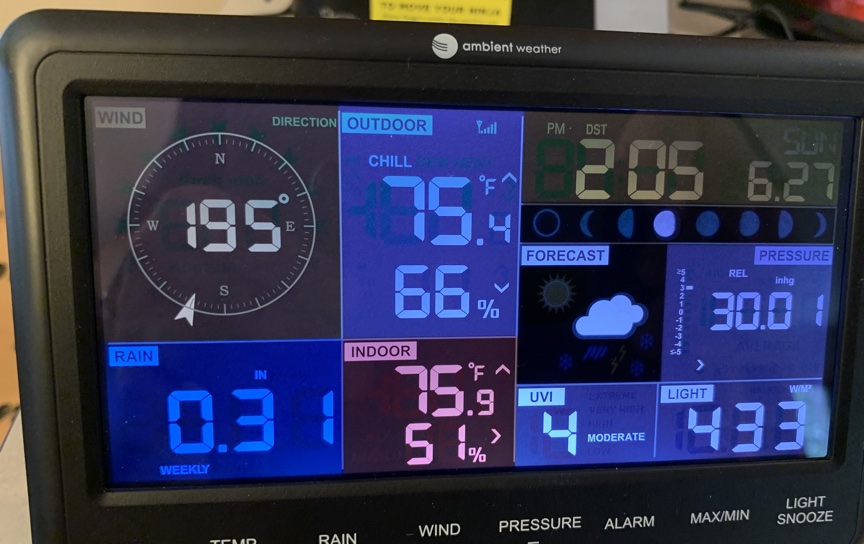
I did get the feed working. Here is access to the data from my device as it is being collected.
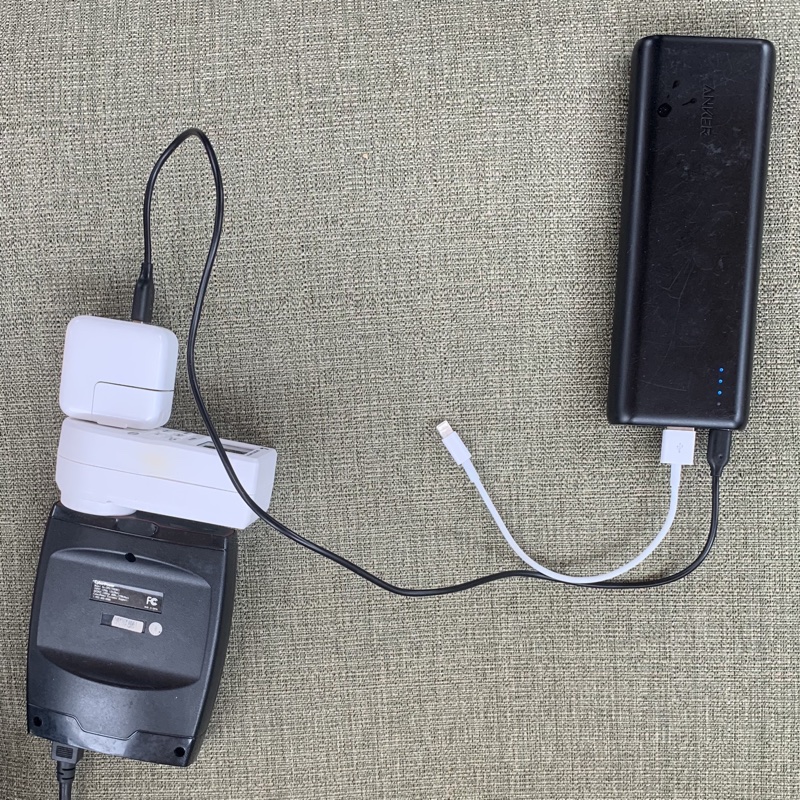
This is an update on my personal solar energy exploration. When the weather was warmer I have used a solar panel to power much of the writing I did in a gazebo located next to our house. I explain the project in previous posts (description, power saved).
While it is now too cold for me to work outside without running a space heater. I decided that I could continue to use the solar panel and just transfer power to my devices using a portable battery pack. This is not a very efficient system, but it works and keeps the project going.
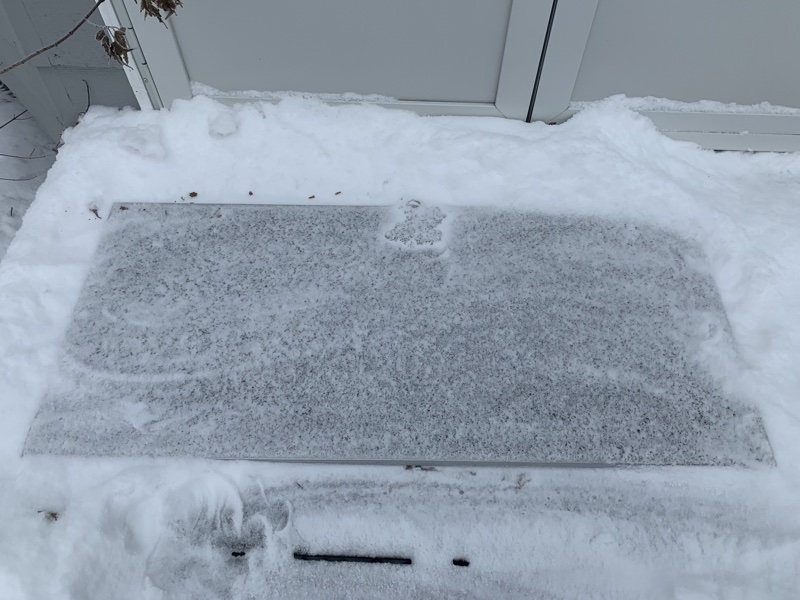
I have always wondered how those with solar power deal with the accumulation of snow on their roof panels. I can’t say I know, but the sun does penetrate a thin layer of ice. Laptops and tablets don’t use much power. There must be some variant of this setup that would make a great classroom project.
Manage Consent
To provide the best experiences, we use technologies like cookies to store and/or access device information. Consenting to these technologies will allow us to process data such as browsing behavior or unique IDs on this site. Not consenting or withdrawing consent, may adversely affect certain features and functions.
Functional
Always active
The technical storage or access is strictly necessary for the legitimate purpose of enabling the use of a specific service explicitly requested by the subscriber or user, or for the sole purpose of carrying out the transmission of a communication over an electronic communications network.
Preferences
The technical storage or access is necessary for the legitimate purpose of storing preferences that are not requested by the subscriber or user.
Statistics
The technical storage or access that is used exclusively for statistical purposes.The technical storage or access that is used exclusively for anonymous statistical purposes. Without a subpoena, voluntary compliance on the part of your Internet Service Provider, or additional records from a third party, information stored or retrieved for this purpose alone cannot usually be used to identify you.
Marketing
The technical storage or access is required to create user profiles to send advertising, or to track the user on a website or across several websites for similar marketing purposes.
You must be logged in to post a comment.