First, data is plural [when it refers to information and not used as an example of a word]. It is the version of datum used to indicate more than one datum. It is difficult to keep that straight as it is so often used incorrectly that many have given up asking for a correction. Data as a singular noun even sounds right. I try to be careful, but no one corrects me any more. Try submitting a research manuscript though claiming “the data is ….” and you will be notified.
So, this my first effort to bring the attention of educators and those who try to focus what educators do on the importance of student experience developing expertise in data collection (methodology) and interpretation. My interest is in the absence of such experiences and the personal belief that the development of data-related collection and analysis skills is more important than other semi-important initiatives such as the focus on coding and computational thinking. I have yet to come up with catchy one or two-word description of the capabilities and dispositions I am focusing on. Data literacy is close and would work, but is already taken and it tends to be defined in a way that is too narrow. The existing use of data literacy is too focused on numerical data and other important categories of data (by my way of thinking) exist,

The collection of data can lead to thinking which I think is key to learning. Thinking does not necessarily have to follow data access, but thinking as an educational task is a matter of taking the opportunities that are there.
I have a record of a very high proportion of the songs I have listened to since 2006. The total number of songs at the start of the time I was writing this was 280,063, but it will be different by the time I am finished because I almost always have music playing in the background when I work. [Remember this comment because it is a clue to something I will ask of you later.] The number 280,063 is potentially interesting because it may indicate something about me relative to you. I may be a bigger music fan than you and maybe not. The number alone hides other interesting data. 280,063 is a statistic that summarizes something about the data. The data in the rawest form consist of a list of song/artist titles. A very long list. Each item on this list is connected with a time and date (when does he and did he listen) and has been categorized by the company responsible for the service by genre (has this old guy’s tastes changed over the years). BTW – the service I use is called Last.FM and the process of sending a signal from the multiple digital devices I use to listen to music to the giant database maintained by the service is called scrobbling. I can’t scrobble when I listen to the radio in my truck or when some member of my family uses the Amazon Echo. But when I am listening to music I select, I am nearly always using a phone, tablet, ipod, ipad, or computer. For those who have now returned to listening to music recorded on records, I get you, but aside from the hiss I think your claim to authenticity is bogus. Authenticity changes with the times. You aren’t listening to piano rolls are you? I admit the general digital-oriented basis for my existence is also somewhat uncommon, but I am what I am.
Just for kicks, I want to show you two charts that summarize these data and because of the trends that are evident ask for an explanation. I will refer to these summary representations as graph A and graph B. I think they show the same thing even though they seem to be moving in opposite directions. The first is the number of songs heard by year and the second the number of songs heard in recent months.
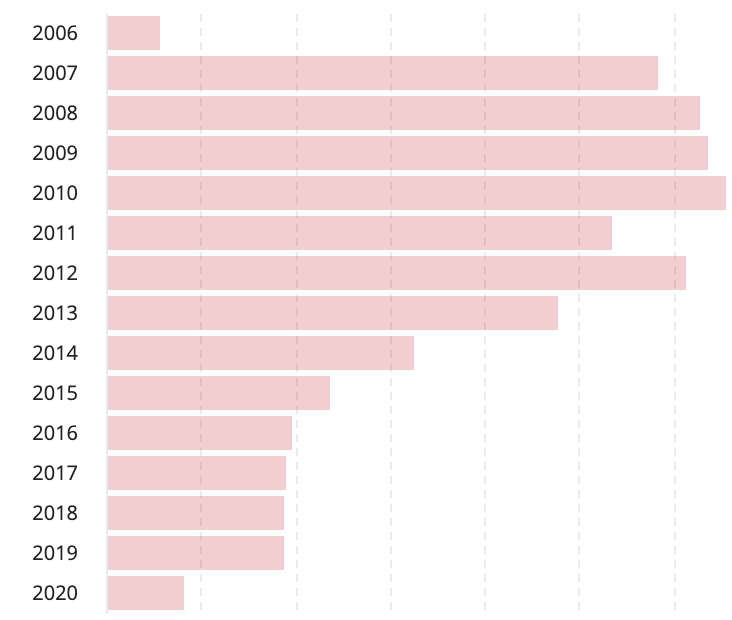
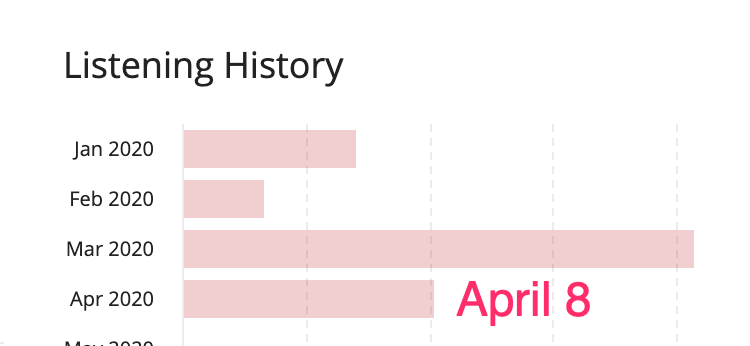
These bar graphs use one form of data to demonstrate something interesting about my life [see the clue I warned you about in one of the first paragraphs]. I obviously know things about my life you don’t and what I know brings meaning to these representations.
Some things I know: I work a lot and when I work I most frequently am reading, writing, coding, etc. using a computer. I retired a few years ago [graph A]. All of our lives have changed recently and we are spending most of our time now isolated in our homes [graph B] finding things to do that are somewhat defined by this reality.
Some reference points. In 2010, I listened to 32,728 songs. In Mar 2020, I listened to 2072 songs and 1226 songs through the first 8 days of April. The average length of a song is between 3-5 minutes, but varies significantly with genre. I suppose this fact is somehow useful in interpretation, but even 3 vs 5 is a large difference when you multiple the limits by 320,000 or so.
I wonder if these data say anything about my psychological state. I listen to a lot of blues, but blues for me is a happy genre. I listen to classical when I am in a somber mood.
Lifetime top artist – Miles Davis – 3919 listens
List 365 days – Bob Marley – 116 plays
![]()
You must be logged in to post a comment.