As I have explored the topic for which I have yet to find a suitable descriptive phrase, I have encountered similar existing initiatives. Claiming originality should always be done with great care. One source I intend to use for several posts seems to have been the focus of school libraries who describe this topic as data literacy and see an important role for librarians relevant to this topic in guiding and supporting student activities in developing this literacy. Without a formal claim of responsibility, I am left to speculate regarding how the connection with the role of librarians explains their interest. My guess is that librarians see data literacy as involving answering certain questions based on a type of information resource (data sources) and librarians exist to help connect users with information resources. I will explore this position and provide some references as my series of learning to generate and use data continues.
One category of public data your librarian might acquaint you with would consist of datasets and databases such as what might be available from the CDC (https://www.cdc.gov/datastatistics/ – selected as an example because of our present situation) or data.gov (https://www.data.gov/). Various activities might be based on the analyses of the data provided. Before I retired, I was aware of academic colleagues who were applying advanced statistical procedures to public data to look for relationships among variables in data that had not been considered.
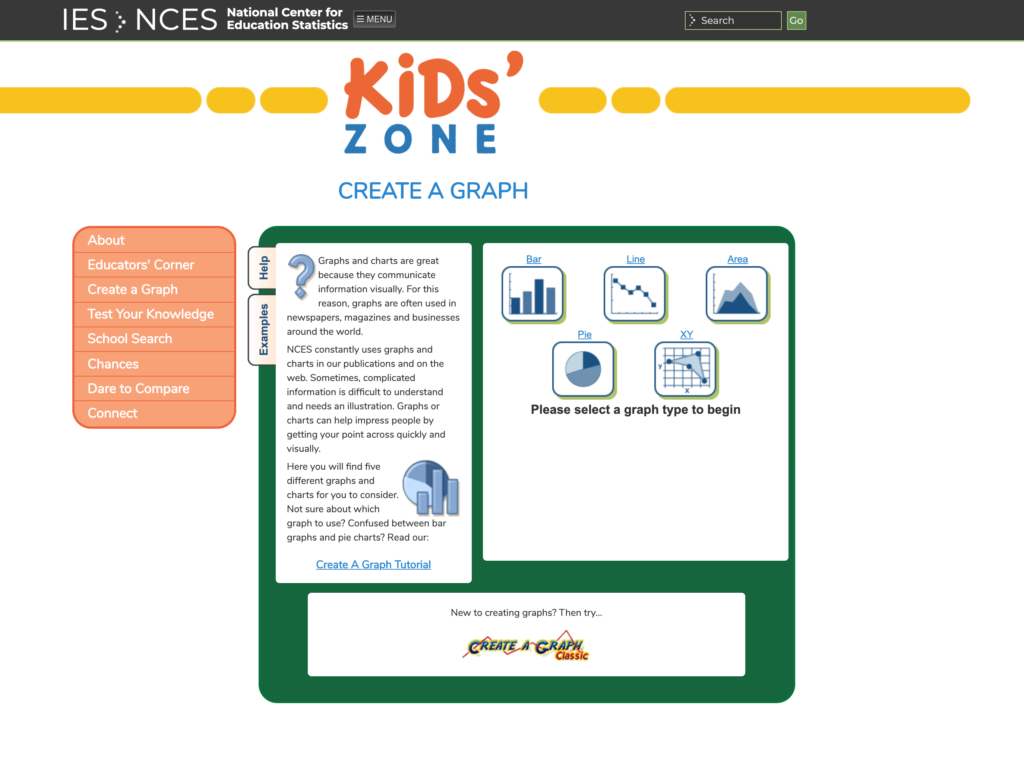
My example here is far less sophisticated. It is also not original as it is proposed by one agency providing such data. The data provided by the U.S. Department of Education (https://www2.ed.gov/rschstat/landing.jhtml) even proposes the use of a graphing tool students can apply to data – Kids’ Zone – Create a Graph (https://nces.ed.gov/nceskids/createagraph/).
I thought I would use graphing to explore data that interests me. The data that caught my attention was taken from a table summarizing 8th graders daily use of a computer broken down by various categories (Table 218.50). I think you can expand this image to read the two rows of data I am focusing on here. These data concern whether a given student qualifies for free/reduced lunch (a proxy for SES) and amount of use.
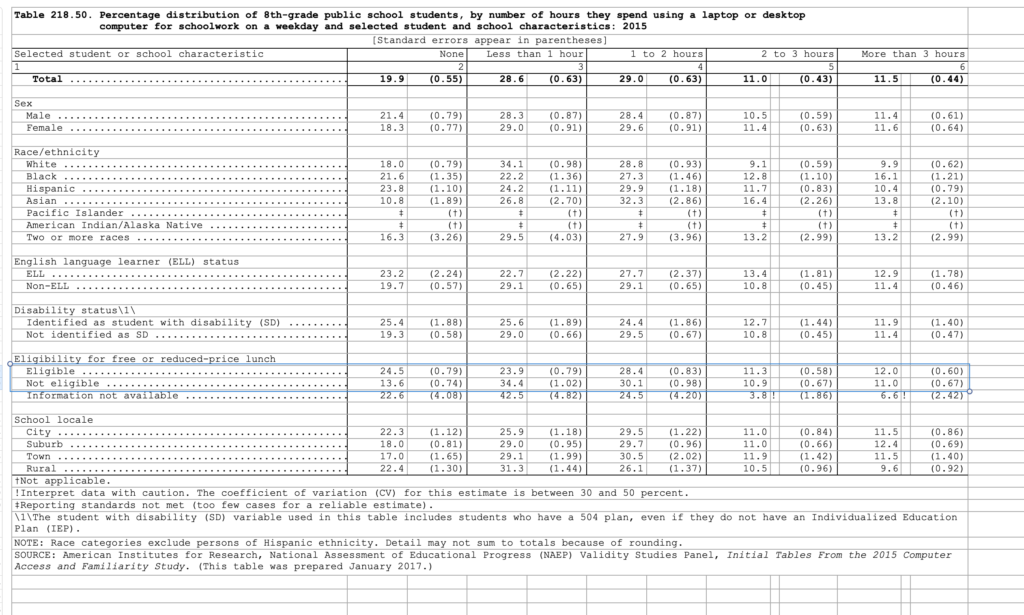
The data table can be downloaded as a xls file (the type of file for use in an Excel Spreadsheet or other spreadsheet program) or just read from the chart.
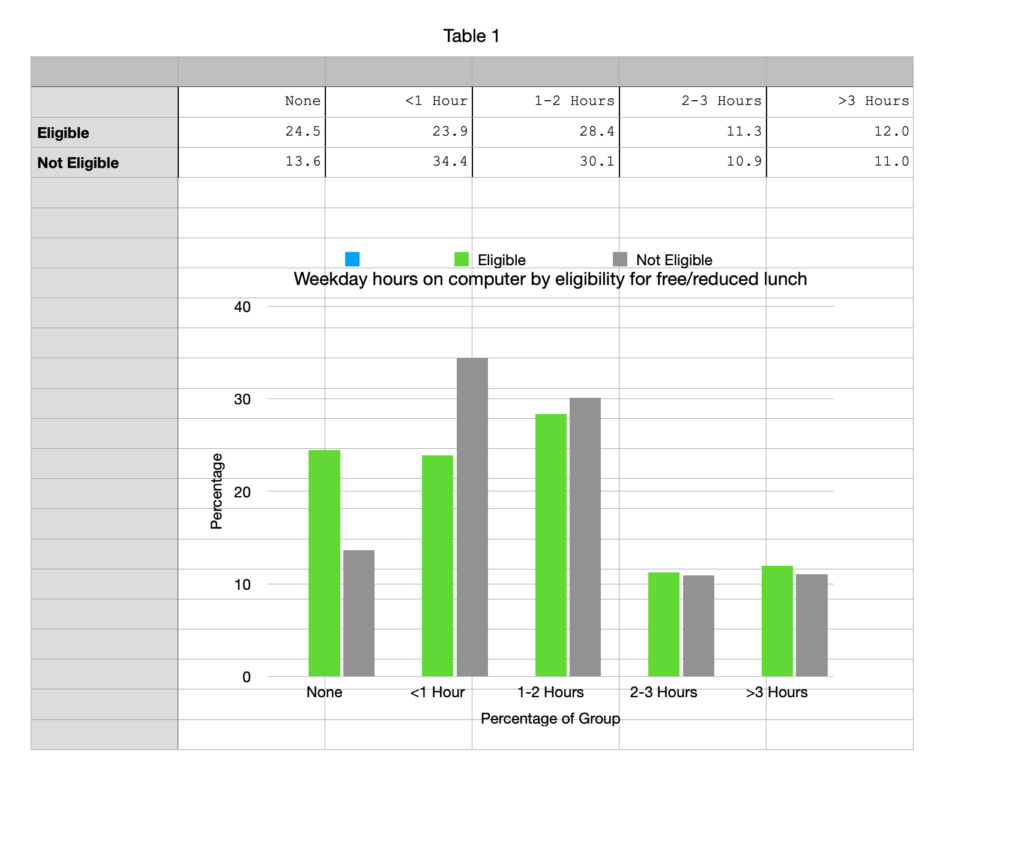
With a spreadsheet, I can select the cells that interest me and turn the values into a graphic representation.
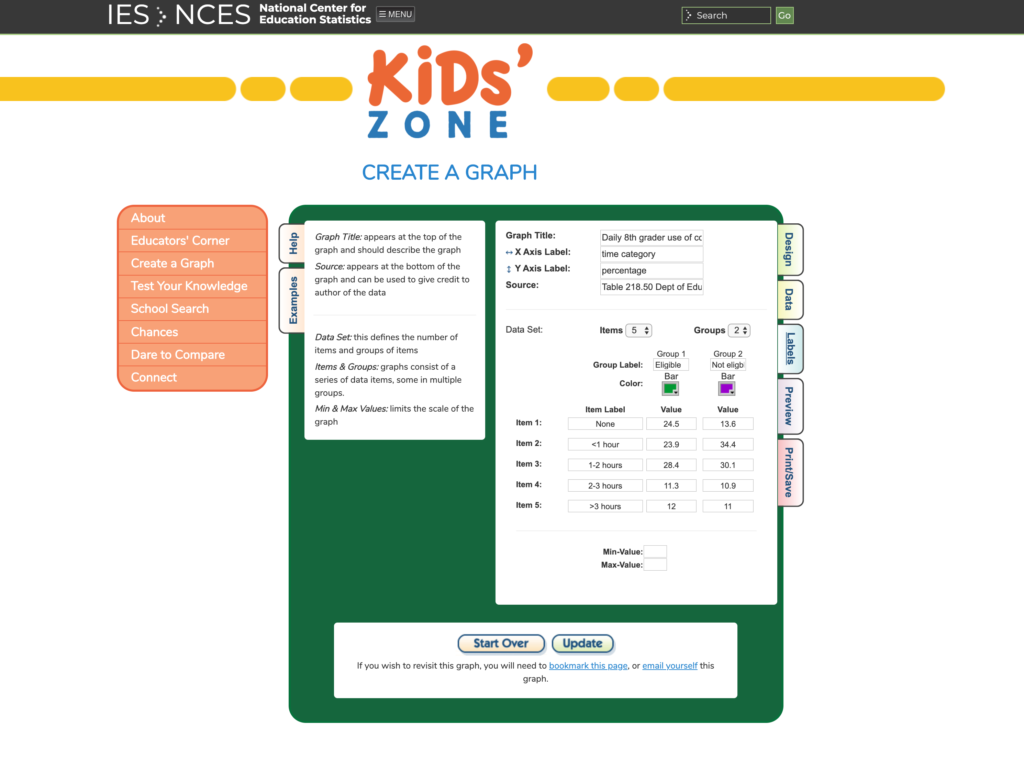
With the Create a Graph program, the data would be entered directly from the keyboard to generate a similar representation.
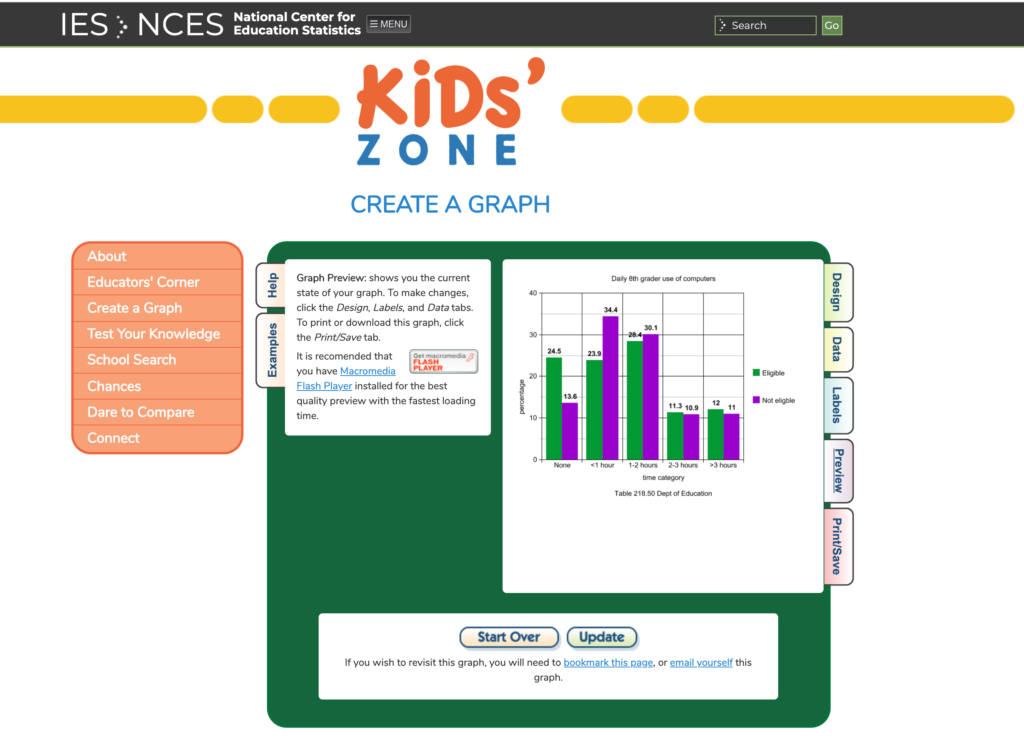
Now we have bar graphs representing data summarizing 8th graders daily use of a computer. What can be observed? Perhaps you find the percentage of 8th graders who report no use interesting. What does this mean? What would you need to know about the methodology that would help you understand? For example, would an iPad be counted as a computer? What about the difference in family resources? The largest gaps are in the groups claiming no use and the group claiming a small amount of use? Here low income seems to matter. It does not seem to matter among the groups using a computer quite a bit. Do you wonder if this was because computers were provided by the schools and this is where most computer use occurred? Research always leads to more questions when the data are limited and the methodology does not allow an answer to questions asked after the process of data collection is complete.
I intend to write a couple more posts focused on the recommendations from the library association. I would describe my goals as very much overlapping with the way this association describes data literacy. If there is a distinction, I would describe it as my interest in data and data collection methods that are not numerical. If data literacy is limited to quantitative data, I must still find another terminology to describe this broader perspective.
![]()