Exploring energy consumption – data collection and thinking

Energy consumption is an important component of so many issues. Energy consumption is a component of global warming and awareness can contribute to more thoughtful consumption or interest in a form of energy generation less dependent on fossil fuels. Energy consumption is a component of economics although for most of us the cost of the energy we consume is not a serious concern. What energy is in its various forms is a topic we learn about as part of our education. Typically, we learn about energy in a rather abstract way based on terms and formula. This is another post on the data and methods we might use to gain some insight into energy as it relates to the multiple topics I describe here.

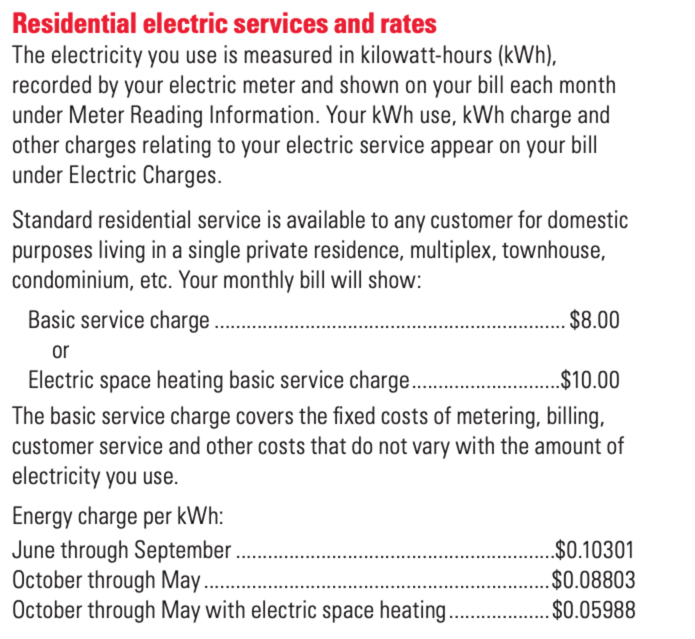
Back in 2015, I became interested in solar energy and purchased a simple kit to be able to store electricity generated from a solar panel. The basic items of this kit are shown here with their corresponding prices as these prices are a component of how one must think about the cost of production and the items offer a concrete way to understand what is involved in a very basic method of production.

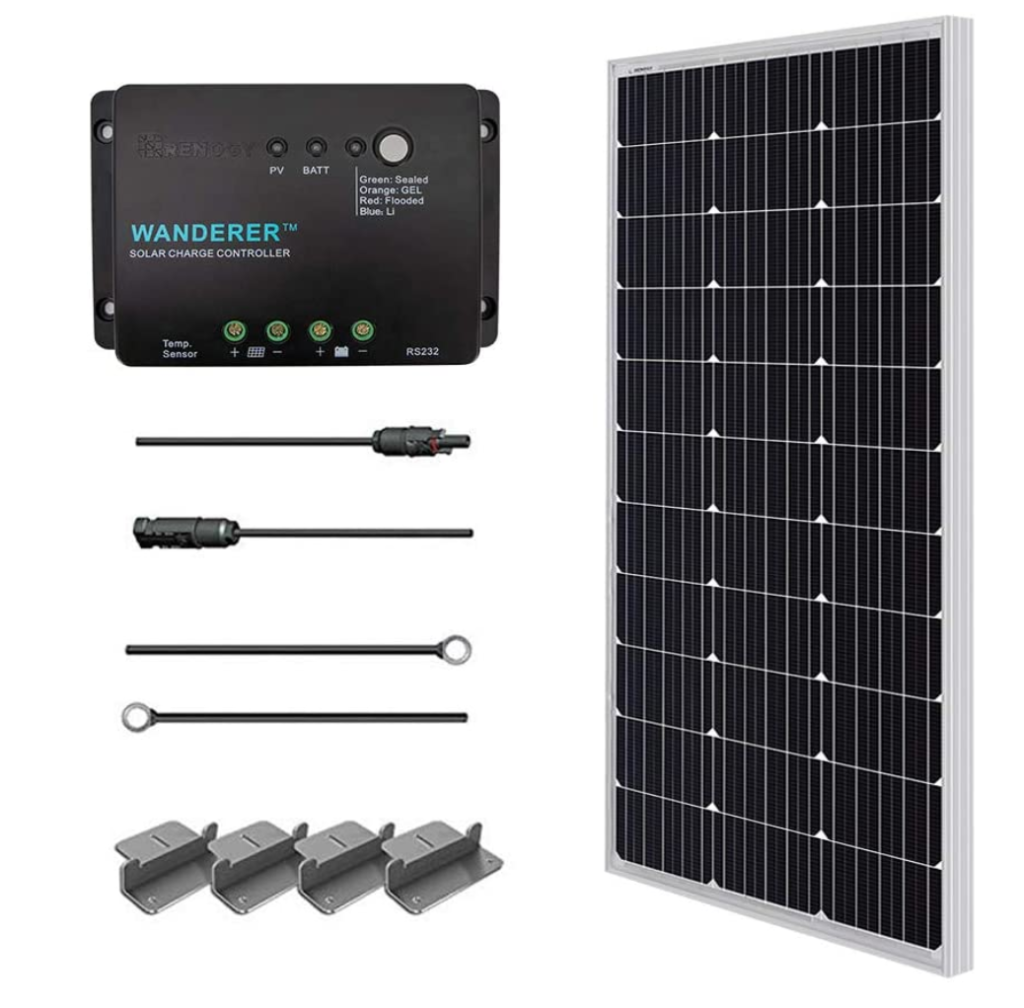
The two significant items in this kit are the 100 Watt solar panel and the charge controller. The value of this kit was $185 at the time of purchase. This 100 watt panel was supposedly capable of storing 500 watth (watt hours) per day under ideal conditions. Think of a 60 watt light bulb consuming 60 watts per hour as a way understand how much electricity it could generate. Ideal means best alignment with full sun. The charge controller protects the battery should the input of energy come too fast and should the battery reach capacity and the input need to be terminated.

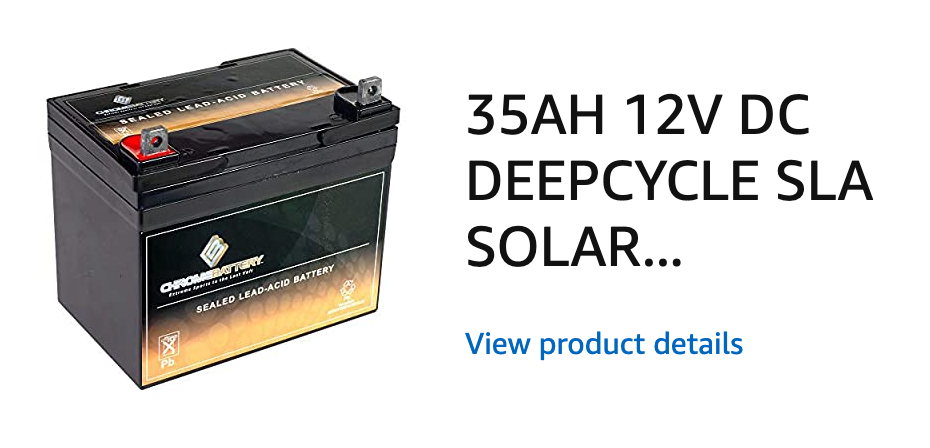
You can use power from a solar panel as it is generated, but typically the approach involves sending power from the panel to a battery and then drawing on the power from the battery as necessary. This is called a deep cycle battery and is designed to be charged and run down. There are many different ways to design batteries. A contrasting type might be designed to serve a function such as would be required in starting a car – big push, but most of the time not being drawn down. The cost of the battery was $75. If you are curious, the items described here might be the collection of resources someone would use to put together a system should they want to use a camper “off grid”.

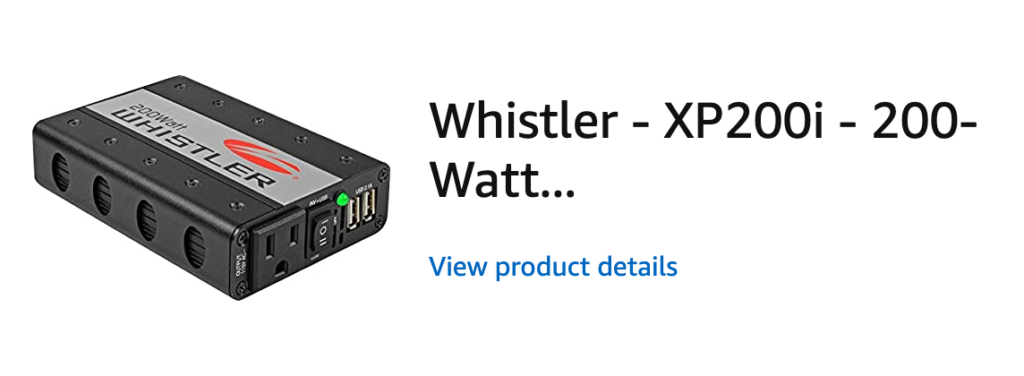
To power most electrical items we use, a 12 volt battery is not of much value. You need to convert the DC (direct current) output from a battery into AC (alternating current). The device to do this job is call an inverter. It is possible you have one in your car you might use (as a passenger) to plug your laptop in while someone else is driving. Cost of this inverter – $28.

So In 2015 I purchased this system capable of charging a battery and then powering low wattage devices for a total of $288. It was for experimenting, but I really never had a good place to use it. I set it up and knew it worked, but that was the end of the story.

Fast forward to the lock down required by the great pandemic of 2020. I am bored and need productive things to do. I decide to make use of my solar system and explore related issues.

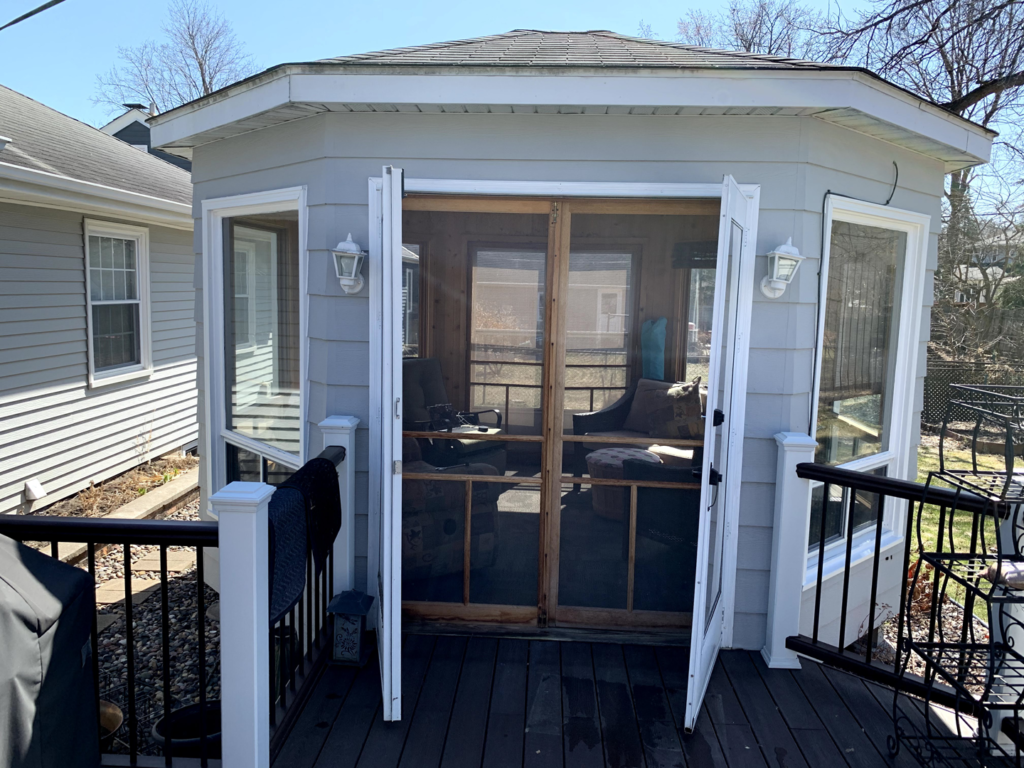
We have this gazebo in our backyard. It is a beautiful little building that is pretty much too hot to use in the summer because of all the windows and too cold to use in Minnesota winters. We are presently in early Spring and I decided given my circumstances of limited movement I would use the Gazebo as a reading/writing shack. I can usually get by without heat. I am running a space heater today because we just received about 6 inches of snow, but this is atypical. Why not explore the utility of the solar panel system?

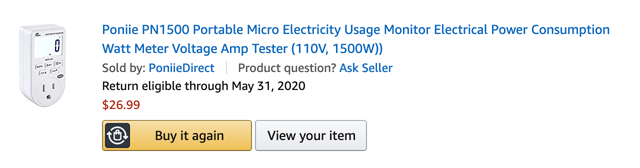
I needed one more tool to do the type of exploring that I thought might be useful. I purchased from Amazon (delivery right to your door even during the lock down) a usage monitor. This device is plugged into an outlet (from my DC/AC converter) and it then measures the power consumed when something is plugged into it. All kinds of data – volts, amps, watts, time power is being used, kwh (consumption in kilowatts).

Who buys these things? I am not certain. I think the idea is you use this device to try to understand what different devices might be contributing to your electricity bill and perhaps trying to decide if you should invest in a more efficient version of something you already use if it is very inefficient. I have a completely different agenda for this device. What a great learning through authentic investigation opportunity. There are plenty of things you can measure to understand power consumption and really appreciate things like the formula – watts = amps x volts.

So, for example, if I can actually measure the three variables in this formula independently, I should be able to see if the formula really works. This device should let me do this. I am using my MacBook pro connected to my solar system through my power consumption meter. The read outs are as follows:

.28 amps

35 watts

124 volts

The values jump around constantly so there is a slight delay as I switch the monitoring device from variable to variable. You can take any two variables and plug them in to the formula watts=amps x volts to predict the third variable and you should see that things come out pretty close.

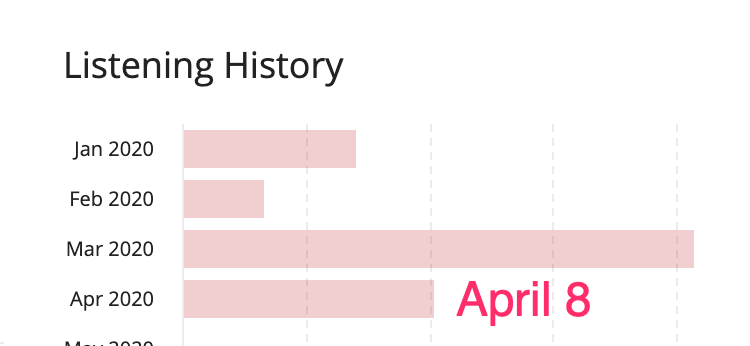
What I was really interested in was how much did I save running my solar system while I worked in the gazebo. I can plug multiple devices into my solar system, but the monitoring device only allows me to measure the power used by one at a time. I ran multiple devices through the system during the week – mostly my laptop, but also my iPad and my Echo (for music).

My idea was to use the rate provided by more power company to see how much money I had saved.

So, the following two values were generated by my monitoring device.

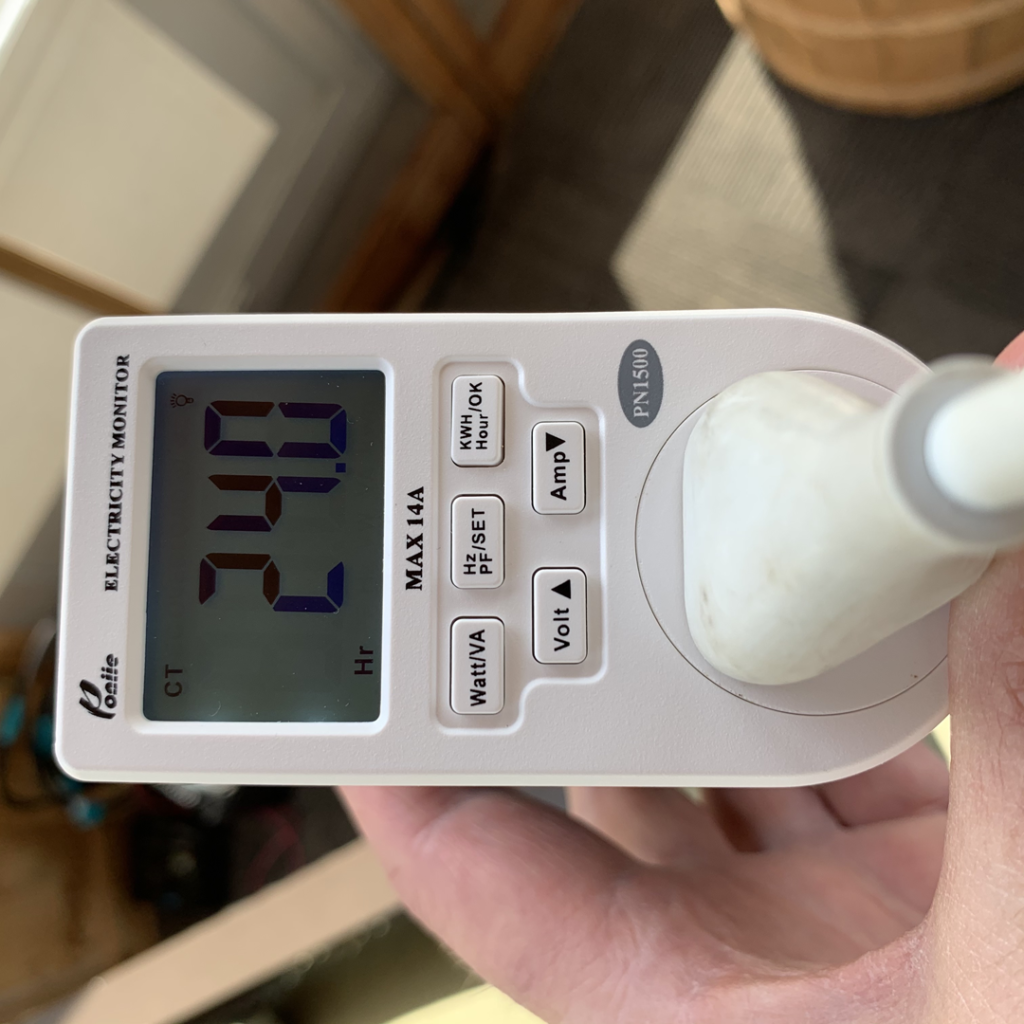
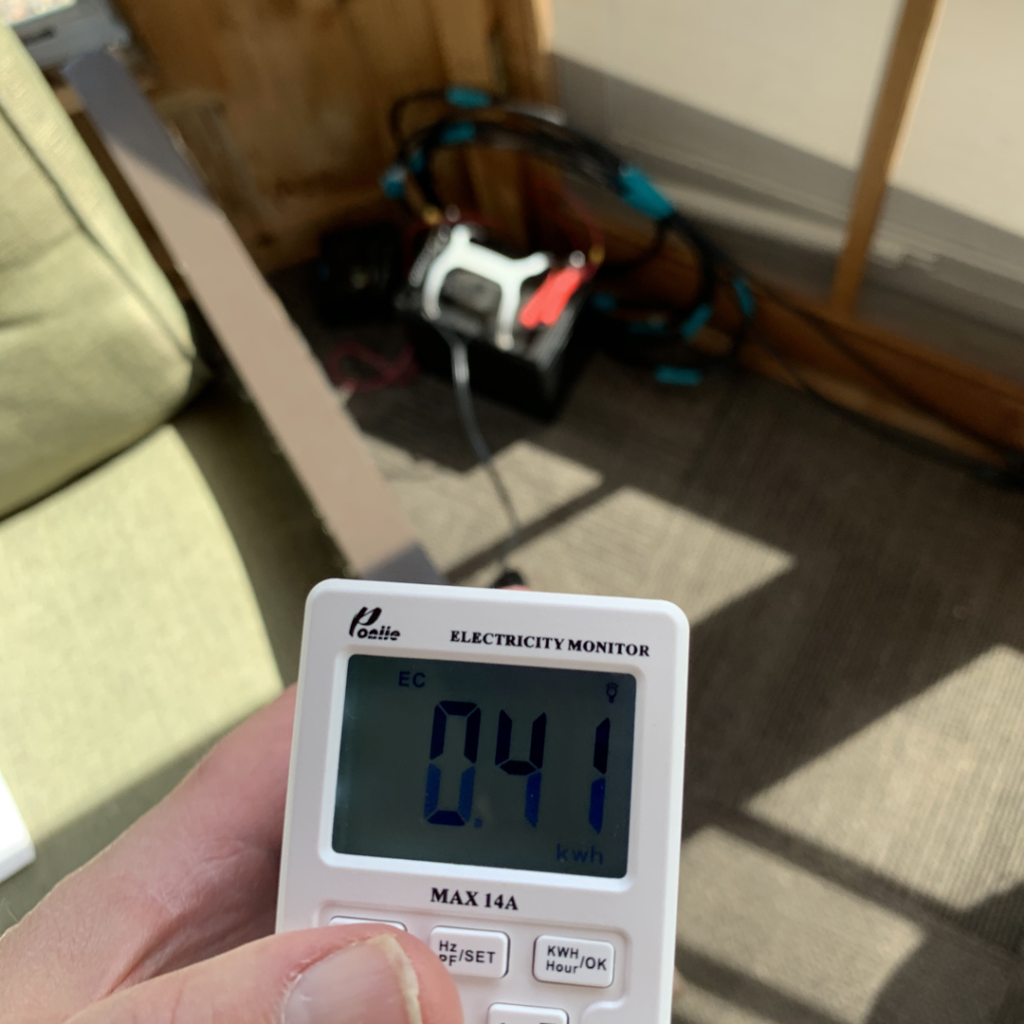
So, in the past week, I spent 24 hours plugged into the solar system in my gazebo. Curiously, the hours came out to exactly a day. I used .41 kilowatts of electricity during that time. .41 x .088 equals about 4 cents. Given my up front cost was $288, four cents does not seem like much.

I found a site that allows you to estimate the cost to use different devices and a laptop was among the devices included. This site used 60 watts as the power consumption of a laptop (I measured my laptop at 35 watts an hour or so ago). My laptop was not doing anything other than powering the screen at the time. I have not compared the load when say I was watching on online video or something that would place a load on the machine. If I use the value from the site instead of my actual total and assume that the ipad and Echo would draw the same as my laptop, I now estimate my cost savings would have been about 16 cents. This result seems very different and I am going to have to collect some more data and do a better job of controlling the variable I ignored (the load required for the different devices) to see if I can come up with something closer to what the online site suggested.

So, this is real research and it is messy. This is why research invests so much time in replication and careful methodology. Perhaps my case for educational applications would have been more persuasive had I not shared my actual data and the confusion these data have generated. Still, I decided this would be the wrong message. I conducted research and published scientific papers for a living (having nothing to do with electricity or solar energy) and I decided no, the messiness of science is part of the experience. I am trying to make the case for learning about data collection, methodology, and analysis as important educational goals. The messiness and the confusion caused by different ways of operationalizing questions and interpreting data are part of the process. I decided this is real science and this is what students need to experience in appreciating the process.

Educators, the power consumption meter was $26. What real questions about power and power consumption could your students ask and answer with this device.

I have taken considerable liberty in describing the mathematics, physics, and engineering involved in collecting, storing, and using energy captured from the sun. The simple system I have described could be constructed using a wide variety of alternatives for each of the devices and these devices interact in complex ways to influence efficiency and longevity. In addition, systems that use multiple panels, multiple batteries, and connecting solar systems to the existing electrical grid add complexity that could be considered. A reasonable source should you be interested in these issues – Build your own low-budget solar system.

Loading

I see data everywhere

First, data is plural [when it refers to information and not used as an example of a word]. It is the version of datum used to indicate more than one datum. It is difficult to keep that straight as it is so often used incorrectly that many have given up asking for a correction. Data as a singular noun even sounds right. I try to be careful, but no one corrects me any more. Try submitting a research manuscript though claiming “the data is ….” and you will be notified.

So, this my first effort to bring the attention of educators and those who try to focus what educators do on the importance of student experience developing expertise in data collection (methodology) and interpretation. My interest is in the absence of such experiences and the personal belief that the development of data-related collection and analysis skills is more important than other semi-important initiatives such as the focus on coding and computational thinking. I have yet to come up with catchy one or two-word description of the capabilities and dispositions I am focusing on. Data literacy is close and would work, but is already taken and it tends to be defined in a way that is too narrow. The existing use of data literacy is too focused on numerical data and other important categories of data (by my way of thinking) exist,

The collection of data can lead to thinking which I think is key to learning. Thinking does not necessarily have to follow data access, but thinking as an educational task is a matter of taking the opportunities that are there.

I have a record of a very high proportion of the songs I have listened to since 2006. The total number of songs at the start of the time I was writing this was 280,063, but it will be different by the time I am finished because I almost always have music playing in the background when I work. [Remember this comment because it is a clue to something I will ask of you later.] The number 280,063 is potentially interesting because it may indicate something about me relative to you. I may be a bigger music fan than you and maybe not. The number alone hides other interesting data. 280,063 is a statistic that summarizes something about the data. The data in the rawest form consist of a list of song/artist titles. A very long list. Each item on this list is connected with a time and date (when does he and did he listen) and has been categorized by the company responsible for the service by genre (has this old guy’s tastes changed over the years). BTW – the service I use is called Last.FM and the process of sending a signal from the multiple digital devices I use to listen to music to the giant database maintained by the service is called scrobbling. I can’t scrobble when I listen to the radio in my truck or when some member of my family uses the Amazon Echo. But when I am listening to music I select, I am nearly always using a phone, tablet, ipod, ipad, or computer. For those who have now returned to listening to music recorded on records, I get you, but aside from the hiss I think your claim to authenticity is bogus. Authenticity changes with the times. You aren’t listening to piano rolls are you? I admit the general digital-oriented basis for my existence is also somewhat uncommon, but I am what I am.

Just for kicks, I want to show you two charts that summarize these data and because of the trends that are evident ask for an explanation. I will refer to these summary representations as graph A and graph B. I think they show the same thing even though they seem to be moving in opposite directions. The first is the number of songs heard by year and the second the number of songs heard in recent months.

These bar graphs use one form of data to demonstrate something interesting about my life [see the clue I warned you about in one of the first paragraphs]. I obviously know things about my life you don’t and what I know brings meaning to these representations.

Some things I know: I work a lot and when I work I most frequently am reading, writing, coding, etc. using a computer. I retired a few years ago [graph A]. All of our lives have changed recently and we are spending most of our time now isolated in our homes [graph B] finding things to do that are somewhat defined by this reality.

Some reference points. In 2010, I listened to 32,728 songs. In Mar 2020, I listened to 2072 songs and 1226 songs through the first 8 days of April. The average length of a song is between 3-5 minutes, but varies significantly with genre. I suppose this fact is somehow useful in interpretation, but even 3 vs 5 is a large difference when you multiple the limits by 320,000 or so.

I wonder if these data say anything about my psychological state. I listen to a lot of blues, but blues for me is a happy genre. I listen to classical when I am in a somber mood.

Lifetime top artist – Miles Davis – 3919 listens

List 365 days – Bob Marley – 116 plays

Loading

New Literacies

A recent post on the Langwitches blog prompted my own extension. The Langwitches post identifies multiple past posts by the author focused on new literacy skills.

Are there really new literacies or is an attempt to generate interest by relabeling? Yes, educational “thought leaders” are not above relabeling to attract attention. I like Leu’s way of making the case for being open to a perspective arguing for the development of different competencies. There is no doubt we spend a great deal of time online and a significant amount of this time is dedicated to finding, processing, and sharing information to learn.

I have spent considerable time over the years writing about learning with technology and how it is different from reading to learn.

Of the research I have read and assigned to my students, Donald Leu has done the best job of identifying and making the case for the skills that differentiate online literacy from more traditional ways of thinking about literacies. I provide several references to Leu and colleagues at the conclusion of this post.

Leu’s model reminds me of the structure for information problem-solving librarians described as the Big-6. I don’t find many educators who have heard of this stage model that identifies stage linked skills, but I use it in the way I describe the multiple proficiencies important in learning from Internet resources. If you take the time to explore both Leu’s list of new literacy skills and the Big-6, I think you see the similarities.

Among the issues that Leu and colleagues identify as making online, self-directed learning unique are the following (I am interpreting here so my summarization may not be exactly what the original authors had in mind):
– We typically go to the Internet with a goal in mind rather than working with content designed to identify goals for us.
– To meet our self-defined goal, we must know how to find relevant information.
– The information we encounter in our search may require the integration of ideas across sources and the elimination of flawed or erroneous ideas.
– Not all information will be presented as text so we must be capable of mixing information encountered in different formats.
– We often are working with others or perhaps to counter the arguments of others to make use of the information we are collecting so sharing and integration of our own work others is necessary.

One of the interesting directions that Leu’s work has taken his group to investigate has been to demonstrate that the implementation of these skills at present varies as a function of income differences. The 2016 article I cite focused on this issue and demonstrated that income gaps exist after accounting for income gaps in traditional reading comprehension. Aside from arguing that education has not closed this gap, the independence of the skills indicates that present literacy development practices are not sufficient to assure online learning competency.

Leu, D. J., Zawilinski, L., Forzani, E., & Timbrell, N. (2014). Best practices in teaching the new literacies of online research and comprehension. Best practices in literacy instruction, 343-364.

Click to access Leu-D.J.-Zawilinski-L.-Forzani-E.-Timbrell-N.-in-press.pdf

Leu, D. J., Forzani, E., Rhoads, C., Maykel, C., Kennedy, C., & Timbrell, N. (2015). The new literacies of online research and comprehension: Rethinking the reading achievement gap. Reading Research Quarterly, 50(1), 37-59.

Loading

Teach highlighting and notetaking skills

Technology offers learners some study skill opportunities often not available until recently. A vast literature investigating highlighting and notetaking exists, but few K-12 educators have been trained to help their students learn to use these study skills effectively. While some may offer advice on taking notes, highlighting has been largely ignored because marking up content intended to be used in the future by other students was forbidden. The use of digital content eliminates this problem, but the opportunities of this content in digital form have been largely ignored.

My own familiarity with highlighting and notetaking go back to the late 1970s and 1980s. It is my impression that these study strategies were heavily investigated during that time frame because of the interest in generative strategies. Interest seemed to wane, but I sense a return of some of these ideas.

I recommend two recent sources:

Miyatsu, Toshiya, Khuyen Nguyen, and Mark A. McDaniel. (2018). Five Popular Study Strategies: Their Pitfalls and Optimal Implementations. Perspectives on Psychological Science 13, 3, 390-407.

Surma, T., Camp, G. & Kirschner, P. (translated) Less is more: Highlighting as learning strategy. [https://3starlearningexperiences.wordpress.com/2019/01/08/less-is-more-highlighting-as-learning-strategy/]

Miyatsu and colleagues make an interesting point about study strategy research. They suggest that researchers have focused on developing new study techniques, but these techniques have been largely ignored. Miyatsu recommends that greater attention be focused on study strategies that are used and how these strategies might be optimized.

Highlighting and annotating (simplified notetaking) fit well with my interest in opportunities for the application of online layering opportunities.

Here is a quick perspective on the highlighting and notetaking research.

The potential benefits of both techniques are approached as potentially resulting from generative processing (activities while reading/listening) and external storage (improvement of review or studying). Of course, these are interrelated as better highlighting and notetaking should improve later review (I will make one comment on whether this relationship still holds at a later point). A quick summary might be that a) the benefit of notetaking appears to be in review and b) the benefit of highlighting appears to be in the generative act of highlighting. I cannot offer an explanation of why these strategies appear to work in different ways. 

One further comment related to my reference to layering is that highlighting and notetaking can be provided rather than generated by students. Providing highlights and annotations can benefit review and may be a way to teach a better generative approach. One of the findings of these more recent reviews of the literature is that K-12 students do not benefit from highlighting opportunities while college students do. This could be because younger students have not practiced this technique and when provided the opportunity do not highlight in an effective way. They do benefit when important content is highlighted for them.

With notetaking more generative strategies (paraphrasing vs verbatim) improves the benefits of the note taking process, but verbatim notes are more effective for external storage (review). I think this could possibly be improved by use of apps that allow notetaking while recording presentations. The notes taken within such apps are timestamped allowing review of the original recorded content when the notes seem confusing. Students using this approach could also just enter a marker, eg., ???, in notes when confused rather than overload working memory and use this marker to return to the spot in the recorded notes for more careful thought when studying. The notes could even be improved later using this same approach. 

If you don’t have access to a college library, you may be unable to read the Myatsu paper, but the second reference is online and offers some useful analysis.

Loading