Oregon Trail was the example of an educational game we described in the first edition of Integrating Technology for Meaningful Learning and it is included in the latest update. Other educational games might make better current examples, but the game was so ubiquitous and part of the K12 experience of so many that the familiarity of the game represents a touchstone we can rely on to make a connection between what we describe as attributes of educational games and a personal experience. The game continues to exist (the point of this post) and also provides the opportunity for a hands-on experience we can direct interested parties to explore.
In case the game was not part of your elementary school experience, the game asks players to take on the role of the leader of a wagon train making the journey from Independence, Missouri, to Oregon. The wagon master makes decisions along the way involving issues such as what supplies to purchase, when to hunt for food, when to stop and when to push on. Hunting for deer is what I remember as the only skill-based action component of the game. The focus was mostly on decision making and how such decisions were successful in dealing with random events one might encounter – e.g., disease, storms, breakdowns. In my opinion as a nongamer, the information provided was minimal and the repetitive process of moving through the game was tedious. As an educational activity (see book), I have always recommended that gameplay be supplemented with other reading and writing activities. Still, a history of Oregon Trail available on Wikipedia indicates that through 2011 sixty-five million copies of some version of the game had been sold. The game was inducted into the video game hall of fame in 2016 and is considered among the most influential early examples of serious games.
Versions of Oregon Trail have been developed by different companies and this continues. A recent offering from GameLoft available through Apple’s Arcade game subscription service represents a good example. The game is more sophisticated with more options and more challenges, but perhaps the most interesting feature is the attempt to be more sensitive to the true history of westward expansion and the impact on Indigenous inhabitants of the lands through which the wagon trains of the game traveled. This NPR story describes the efforts of Gameloft to more accurately represent Indigenous people in its representation of the Oregon Trail. The company brought in three Indigenous histories to offer advice on the way Native people were represented.
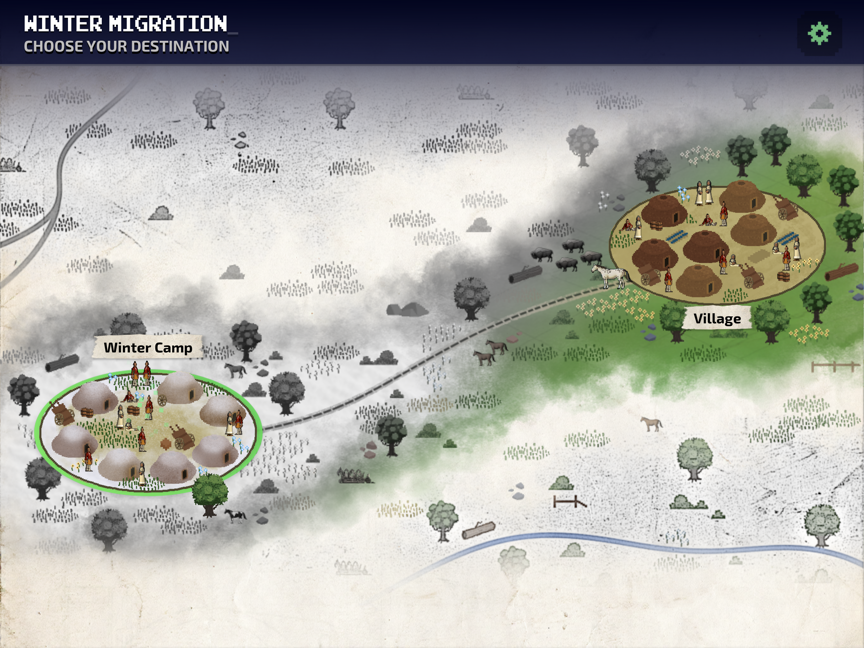
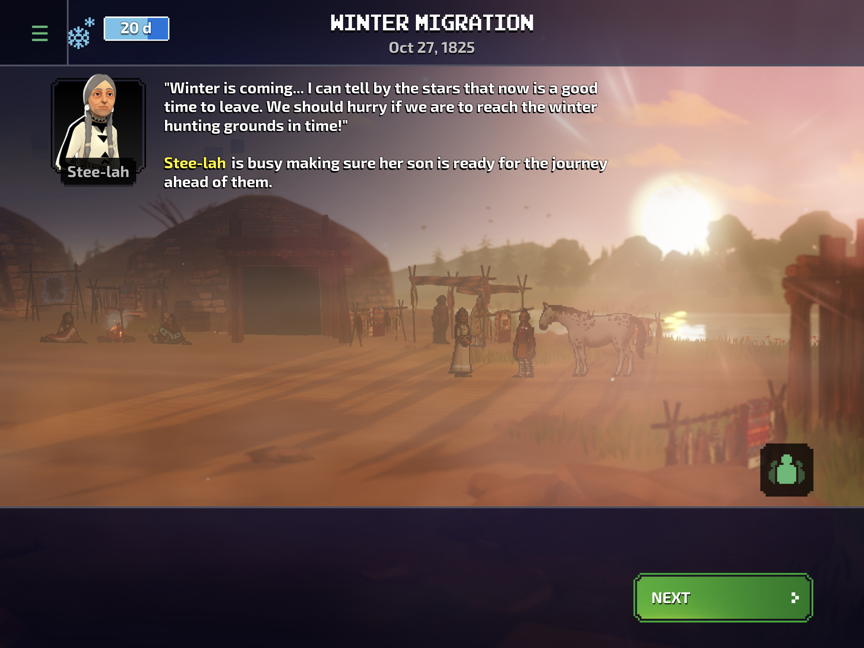
The new version of Oregon Trail is designed to be played repeatedly and the opportunity to fashion different groups making a trip changes the experience depending on the members of the group. Each segment of the trip involves multiple choice points that route the party through different locations with different experiences. The perspective of Native Americans is presented in alternate “journeys” using similar game components.
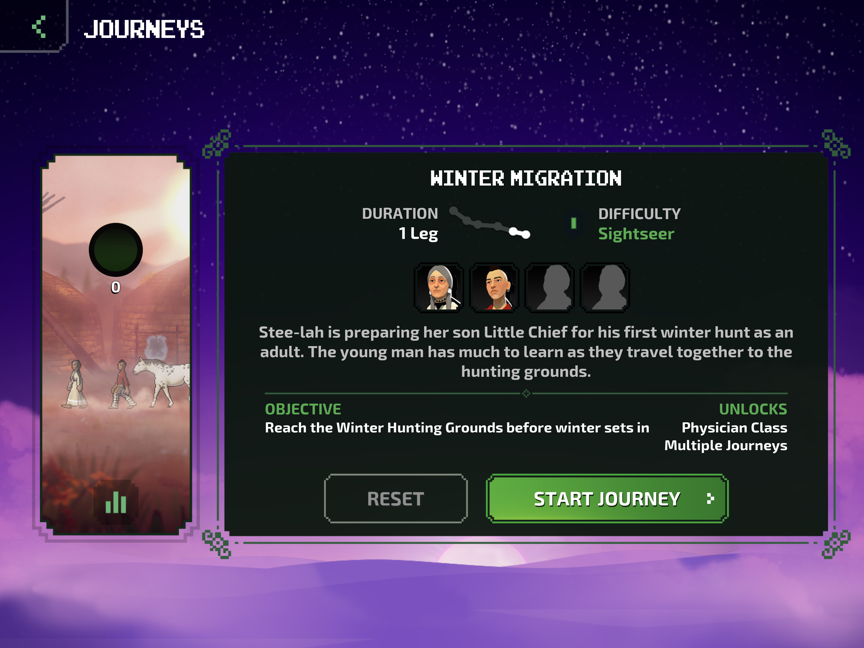
I have spent a few hours with the new game and my assessment of the educational impact remains pretty much the same. I also don’t see this game gaining traction in classrooms because of the Apple game subscription system used to make the game available. The efforts to improve the historical accuracy of the game are certainly to be appreciated.
![]()

You must be logged in to post a comment.