This is a continuation of my previous post explaining how data generated by the Ambient Weather station can be exported and used in data literacy projects.
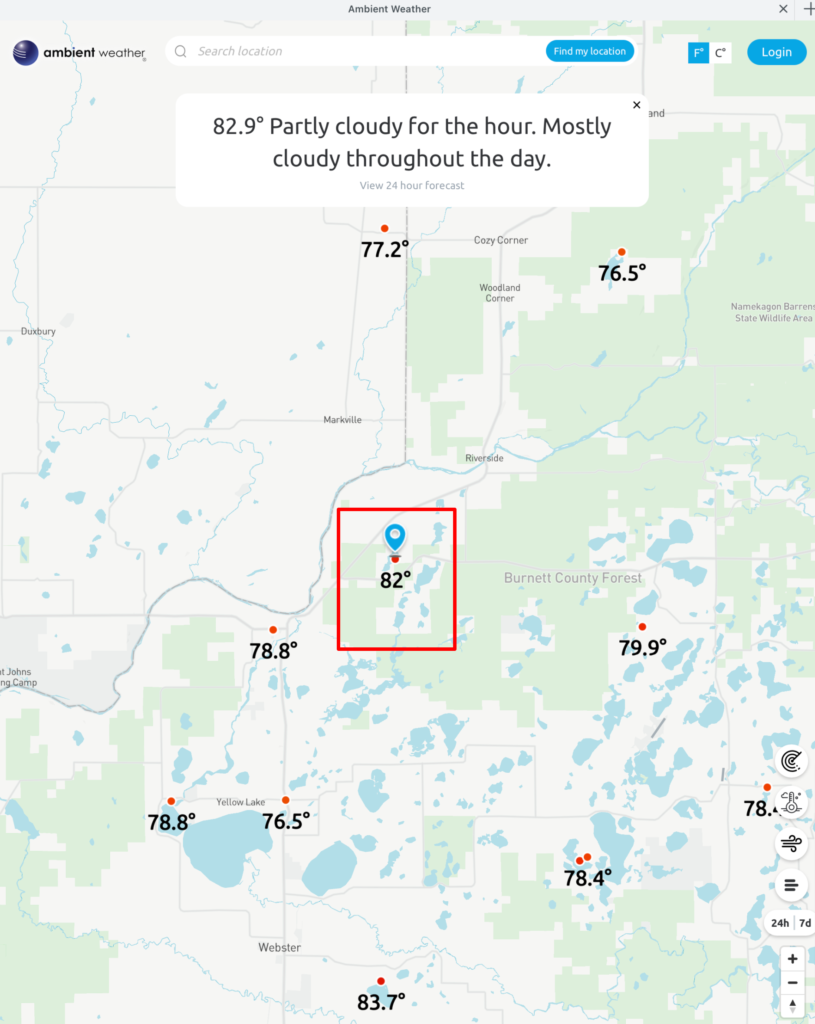
If the owner of the personal weather station I describe in my previous post is interested, you can add the feed from your station into multiple weather aggregation sites – see the following image (our site is identified by the red box).

Clicking on any of the comparable weather stations identified in this map allows access to the data collected by that station. I am proposing that installing such a station and becoming part of this network would provide the possibility for various data literacy projects for schools AND be a way to study the science of weather.

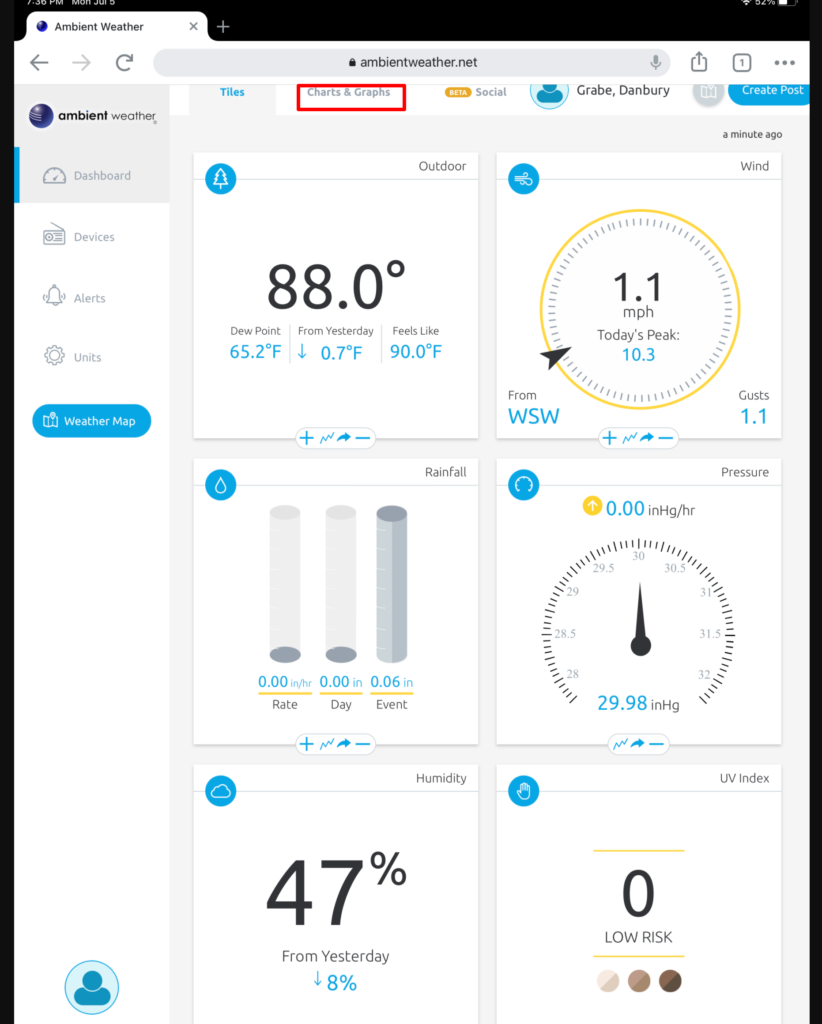
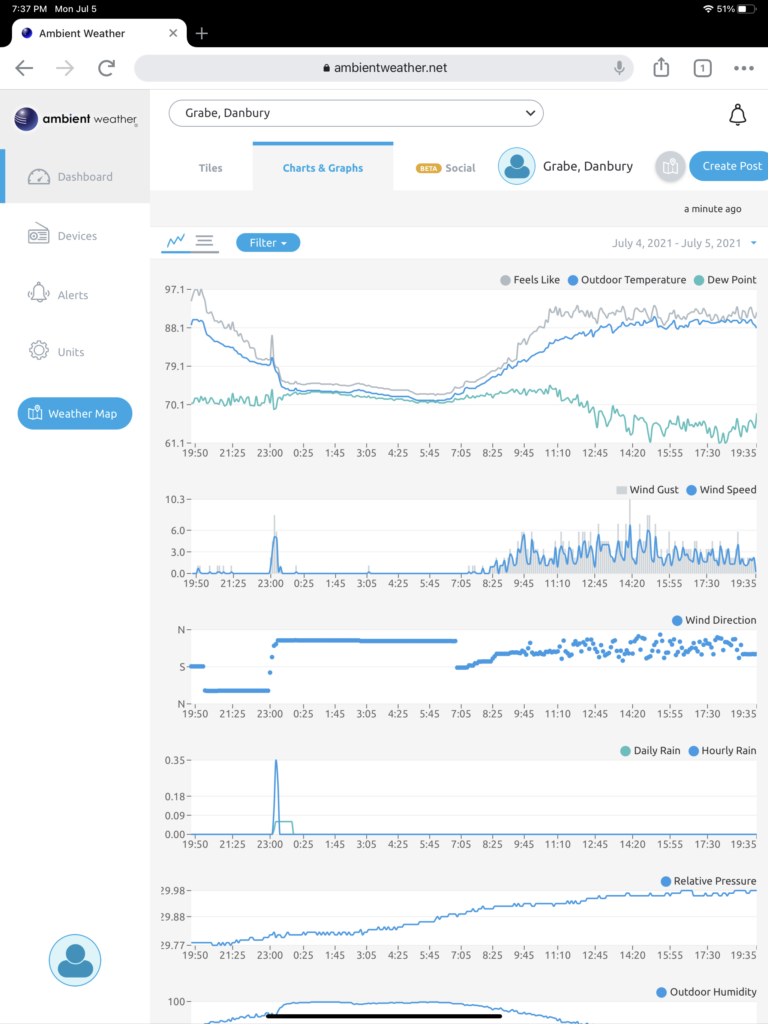
The Charts and Graphs link from this display (see red box) allows access to the data.

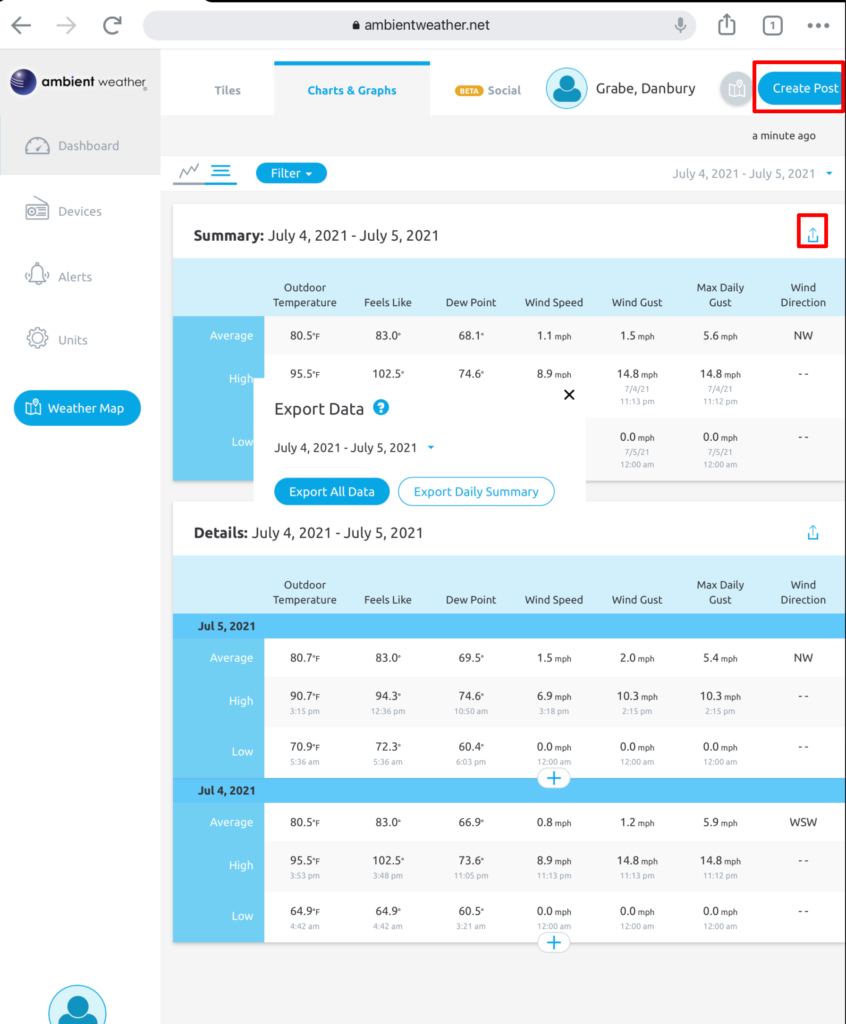
The data generating these graphs can be exported. Two features are identified in the following image – the download button and the opportunity to offer a post to the network (images, descriptions of weather events, etc.)

The data comes to your computer as a CSV file that can be opened in any spreadsheet for manipulation or integration with other data sources.

41 total views , 1 views today