
How common is cyberbullying and who is involved?
Basic descriptive statistics on the prevalence of cyberbullying should be of interest to teachers and administrators. How common is the problem? What proportion of students are harassed and how many harass others? Is there a grade level or a group that appears to be most vulnerable? How are students bullied online? It would seem that such data could be obtained by surveying students and would offer a way to understand the seriousness of the problem.
As basic as these expectations may seem, attempting to find answers to these questions is frustrating. It is not that there are not plenty of descriptive statistics available. Rather, it is frustrating that these statistics are so variable. A summary of the literature completed in 2008 (Juvonen & Gross, 2008) reported a range in the reported rate of being bullied online that ranged from 1% to 49% of the group sampled. Consider how someone using different studies from this collection could portray very different pictures of the problem. Depending on the studies selected, it might seem that very few students are harassed online or that the problem is extremely common. This is a great example of an exercise in information literacy requiring critical thinking. How can this range of findings be possible? What do you think? Here are some things to consider.
We sometimes ask students we teach whether or not they believe that you can “lie with statistics?” This is a common, but cynical assumption. The validity of the statement kind of depends on what you think the expression means. Statistics involve basic mathematical operations applied to data. Basic mathematical operations produce consistent outcomes allowing little flexibility. The solution to a procedure is the solution. One plus one pretty much always equals two. What can be obscure are the methods used to generate the data that are analyzed. If these methods are not clearly described and understood, the summary description resulting from the data can be misused or misleading.
One of the biggest differences in the research on cyberbullying concerns the characteristics of the sample used to generate the data. The appropriateness of the sample depends on the questions that are being asked. A district administrator might want to understand the extent of cyberbullying in her district and ask that all middle school teacher distribute a survey during home room to generate data to be studied. This method might provide the answer that administrator was seeking, but it is not the answer we would want to use here. The sample is not appropriate to our questions. Perhaps the administrator had the data collected because parents frequently reported problems and she wanted to follow up on their concerns. What we do not know is whether a high rate of cyberbullying in this school is typical. Our questions are a little different than the questions of interest in that particular district.
Only a few of the studies providing descriptive data concerning the problems of cyberbullying are based on a carefully constructed, representative national sample of specific age groups. Such data are expensive and time consuming to collect and mostly of interest to those of us commenting on the general state of the problem or those making decisions regarding what national policies may be necessary. Several research groups having taken on the challenge of providing descriptive statistics offering a national perspective. The Pew Internet and American Life Project (e.g., Lenhart, 2007), the Youth Internet Safety Surveys (YISS I and II - Ybarra & Mitchell, 2004), and the Growing Up With Media survey (Ybarra, Diener-West & Leaf, 2007) made phone calls to a carefully selected group of adolescents (the various studies covered the age range of 10-17) and asked about cyberbullying. These studies report a narrower range of the likelihood of being bullied (7% - 35%), but still a larger range than one might expect from similar groups of respondents.
A major part of the challenge in understanding this issue may involve reaching a similar position on exactly what being cyberbullied means. This is a good example of the difference in how researchers and the rest of us approach an issue. If you are involved in education, there is some probability that you have discussed the topics of bullying or cyberbullying. You can do this without have to specify how you define cyberbullying. In contrast, researchers have to be far more precise. If nothing else, they must develop survey questions that participants answer. If you put yourself in a researcher’s shoes for a minute, you might appreciate the challenge they face. Specifically, what would you ask students in your class to determine if they have been cyberbullied? You cannot really say - have you been cyberbullied? This just passes the lack of precision on to the student. You have to ask about specific experiences. If you force yourself to actually complete this task and then compare your questions with those of your peers, it might become apparent why different studies generate somewhat different outcomes because they define acts of cyberbullying in different ways.
Here are some examples of differences we have observed in the implementation of the methods used to obtain information about cyberbullying:
- The time period addressed by survey questions vary. There is a difference between “has this ever happened to you” and “has this happened to you during the past year”. Asking questions about experiences occurring during the past year seems to be the most common approach.
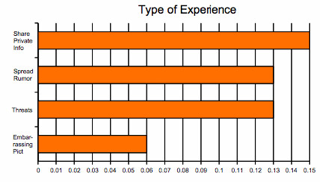
- When specific experiences are identified, what is considered cyberbullying may vary greatly. Some studies (e.g., Lenhart, 2007) ask about multiple specific behaviors. For example, Lenhart (2007) found that 15% of respondents had experienced what they thought was a private message being forwarded without their permission and 6% had experienced someone distributed someone sharing an embarrassing picture of them. Some studies take a more basic approach. One the studies we identified as taking great pains to use a representative sample of young people asked respondents whether others had made a “rude or nasty” comment directed at them (Ybarra & Mitchell, 2004). Have you ever received an email containing what you consider a “rude or nasty” comment? Twenty-eight percent of those surveyed indicated they had such an experience. You can understand the challenge in attempting to integrate such findings. It does not seem surprising that more individuals have been the target of a rude or nasty comment than have been portrayed in an embarrassing picture.
- Our final issue involves the matter of how the “victim” perceives the experiences. The issue of perception may have occurred to you when the phrase “rude or nasty” comment was identified. I would not necessarily consider being the target of a rude comment as being bullied. Wolak, Mitchell and Finkelhor (2006) report a lower proportion of 10-17 year olds as experiencing cyberbullying than other studies but they apply a more complicated definition. Cyberbullying from their perspective involves a series of incidents and a power imbalance. A power imbalance is determined by either a sense of personal distress or an effort to report the incidents to an adult. These researchers take this perspective partly to extend a common definition from the study of bullying to cyberbullying. The phrase “online harassment” is applied to many situations others would label as bullying.
The issues raised by these examples may not matter to you. We identify these issues not to dispute the significance of the problem, but to indicate that the problem is complex with different researchers approaching the study of even basic aspects of the topic from different perspectives. Finally, what might be a working description of the present level of cyberbullying (all of these issues aside). After completing a recent analysis of the research on this issue and after recognizing many of the same issues we have just raised, Patchin and Hinduja (2012), two of the most prominent researchers in this area, suggest that educators assume 20-25% of school-aged children have been bullied within the time span of the past few months. Clearly, we are considering a significant issue impacting many students who make use of the Internet.
Demographics - characteristics of those bullied