
Demographic factors associated with the frequency of being bullied
Attempts to determine if certain groups of young people are more likely than other groups to experience cyberbullying is in a similar state to the effort to estimate the amount of cyberbullying. Studies reach very different conclusions. Again, because of differences in how cyberbullying is defined and variability in the nature of samples asked to respond to these surveys, this lack of consistency is probably not that surprising. Attempting to identify groups more likely to be bullied is more than a matter of academic curiosity. Group differences may provide some insight into why cyberbullying occurs or allow educational institutions to target intervention efforts (Tokunaga, 2010). For example, if a school district decided to commit to an intervention effort including the use of activities during “class time”, at what grade level or levels should this intervention be targeted?
Grade level and gender - Grade level (age) and gender are included as potential demographic predictors in many studies. When gender differences are present, females seem to be more frequently victimized than males. However, in a recent summary of the existing literature, Tokunaga (2010) concluded that gender differences were of limited significance, but the frequency of cyberbullying appeared to peak in middle school. One of the most frequently cited studies focused on grade level differences (Williams & Guerra, 2008), observed that the frequency of cyberbullying among 8th graders was higher than among 5th graders or high school students.
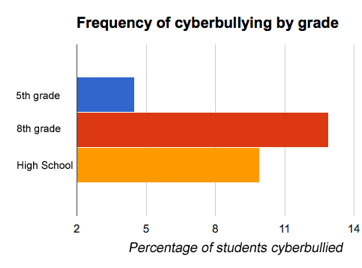
Image based on Williams and Guerra, 2008.
Intervention - What can schools do?