
A spreadsheet activity
Once creative educators understand the basics of how a spreadsheet works, ideas related to the content they teach seem to materialize. We describe one example and provide a video to show the corresponding procedures. We cannot claim credit for this idea (Niess, 1998), but it deals with subject matter we all probably recognize.
Using a Spreadsheet to Help Understand the Solution to an Algebraic Equation
Solve the equation 4x – 14 = 4 – 2x. We expect that you still remember how to do this and that you end up with x = 3. How did you find the solution? You probably moved –2x to the left side of the equation (reversing the sign) and –14 to the right side. Then you added and subtracted where possible to generate 6x = 18. From there you divided each side by 6 and arrived at the answer: x = 3.
Now here is a different question: What does x = 3 symbolize? What have you found when you solve the equation 4x – 14 = 4 – 2x? We suspect that many people who can solve the problem we have provided have no idea what the solution represents.
You may not understand what you have found because you were able to arrive at an answer by relying on some well-learned rules. Collectively these rules represent an algorithm: a procedure that generates a correct solution if followed correctly. But rote algorithmic procedures do not ensure understanding, and for that reason national math standards specify that students should learn to solve equations in different ways (National Council of Teachers of Mathematics, 2000). A spreadsheet provides one alternative to the algorithmic approach you have learned to rely on.
Look carefully at the figure that follows. In row 3, you see a sequence of numerical values: 1, 2, 3, and so on. These numbers will be used as values for the variable x. The cell entries in row 4 are calculated by substituting the value for x from row 3 in the expression 4x – 14. Using the spreadsheet, cell C4 would be assigned to the value =4*c3 – 14. Once entered, this formula could be copied to the other cells of row 4 to generate the remaining values quickly. Cell C5 would be calculated as =4 – 2*c3. Again, the formula would be copied to the other cells of row 5.
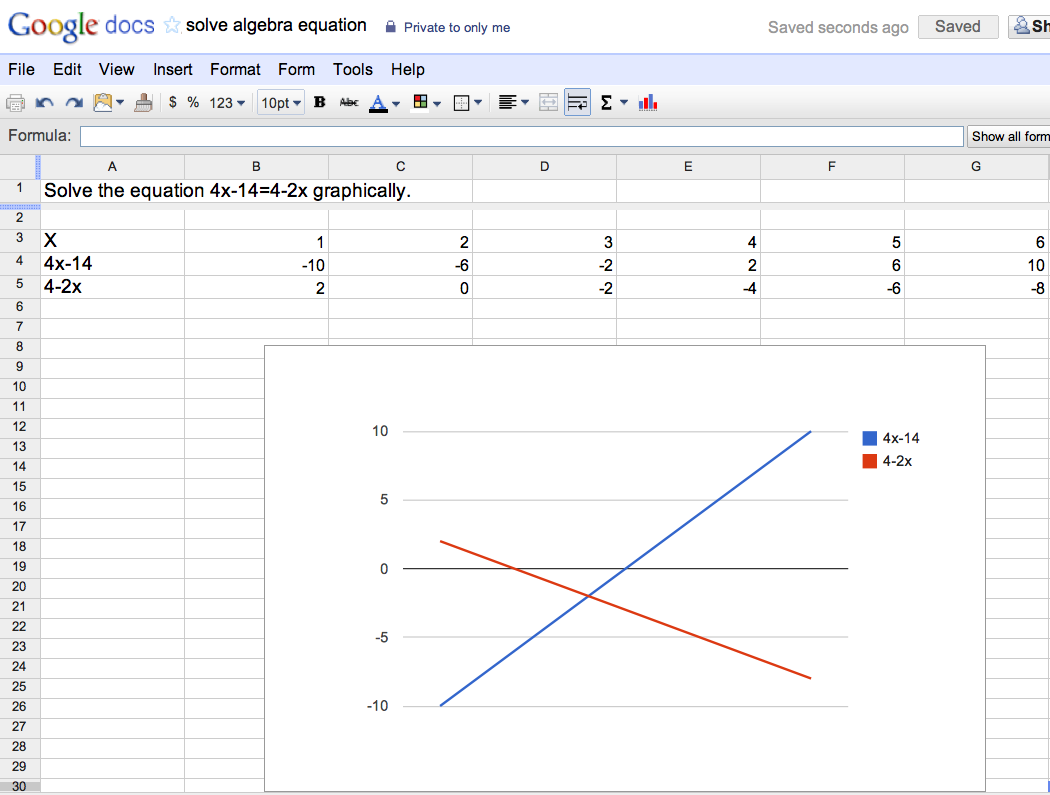
A spreadsheet usually allows the generation of graphs as an alternative way to represent data. If rows 4 and 5 are transformed into a line graph, the display also contained in Figure 3.X is generated. If you look carefully, you should have a better understanding of what the solution to 4x – 14 = 4 – 2x represents. It is the x value at the intersection of the lines defined by 4x – 14 and 4 – 2x.
Source: Based on Niess, 1998.
Now, we encourage you to watch the screencast showing the procedures used to prepare the entries in the spreadsheet and generate the line graph.
Tutorial - solving equation with spreadsheet [tutorial]
Be patient if nothing appears in this space - a video file is downloading in the background. This video requires the Apple Quicktime plugin (download).