
Introductory project (continued)
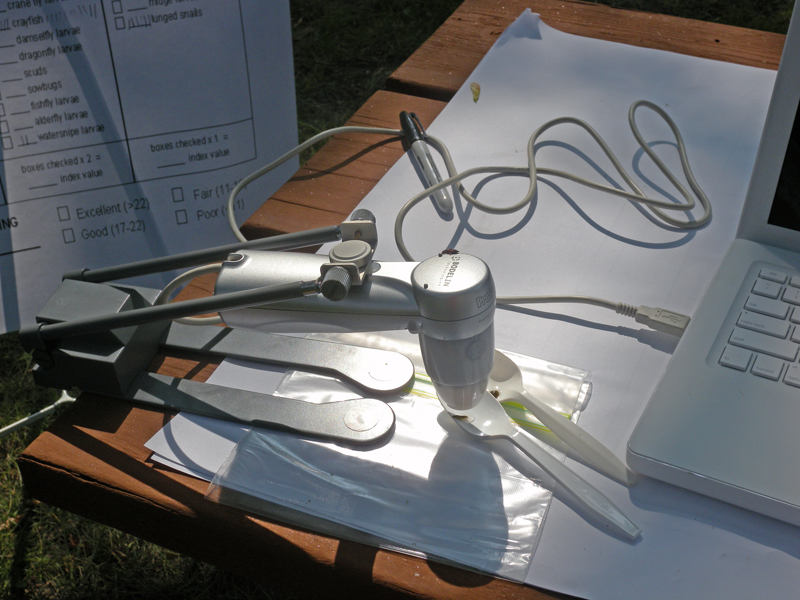
Anyone reading this content is likely familiar with capturing images using a digital camera or a cell phone. You may not have considered applying digital photography to benefit learning, but you would be familiar with the equipment that would be required. How about a digital microscope? Microscopes are common equipment in the science laboratory, but taking a microscope into the field would be unlikely because of the fragility and cost of this equipment. Digital microscopes are less expensive, portable, and perfectly suited to the size of the organisms of interest here. You cannot really take a useful picture of a stone fly with a cell phone, but a digital microscope connected to a laptop computer is perfect for this task.
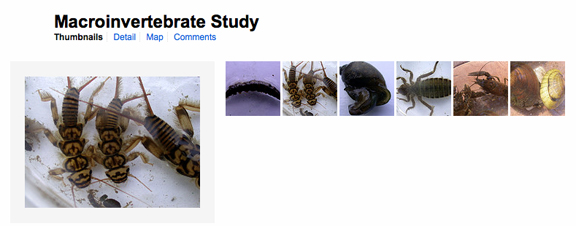
A collection of images shared by way of an image sharing site (e.g., Flickr) organizes the collection across the multiple groups that visited the park. There are multiple middle schools in our community and different groups from each school visit the park on different days. Comparing experiences is another way to increase and prolong interest in the project. Depending on how permissions are assigned, an image sharing site can be used to openly or selectively share an image collection.
Finally, one classroom teacher made use of the images collected from the water quality and other learning stations to allow pairs of students to create video reflections exploring what they learned from their experience (e.g., iMovie). These short videos were shared with classmates and with parents.
Probes - One year the water quality station focused on various methods for measuring variables that might be relevant in understanding what water quality means. What made this experience unique was an effort to contrast older and newer methods for measuring important variables (watch the video for a description). Students measured pH, dissolved oxygen, and turbidity and gathered information on water flow and depth. Students used chemical test kits and probes. They used weighted string and sonar. They used viewing tubes and an underwater camera. The consistency of data gathered with different methods was compared. In addition to learning about how water quality influences the presence of biological organisms, students had an opportunity to contrast multiple methods for measuring the same variables and perhaps may have come to appreciated how advances in technology have made data collection much easier.
The use of probes to collect data used to operationalize water quality have become a standard part of the experience at the state park. The practice of science typically requires the collection of data to test hypotheses and equipment is now available to allow students to function as practitioners. We use the term probe to describe the combination of a specialized sensor and the interface that connects this sensor to a computer or handheld device. By “specialized”, we mean that a given sensor is typically capable of collecting one type of information (e.g., temperature, pH, dissolved oxygen). The interface allows the user to tell the sensor what to do, stores data the sensor generates, and often transfers data to a computer or sometimes a calculator for further analysis. So, different sensors are attached to the interface depending on what variable is to be measured.
Data storage and organization - Seven middle school groups visit Turtle River each year and each group was further divided into multiple subgroups to equalize students across the different stations. The same set of measurements were repeated many times. This redundancy offers the opportunity to determine just how stable the data the students collect are. Scientists might refer to this as reliability. Some of the activities have also been repeated now for several years and there is the possibility of comparing findings from year to year. Did we find an exceptionally large number of crayfish this year or is this typical? Does pH in water from the same location vary or is it pretty much the same from year to year?
The original technique for comparing data across groups was pretty low tech. A large grid was laid out on a flip chart. The rows were the variables to be measured and each column represented a different student group. As data were collected, the findings were entered in the appropriate cells. Old data entries were covered with sticky notes until new information was added and then the new information was contrasted with previous findings. You can catch a glimpse of this process in the video we have attached.
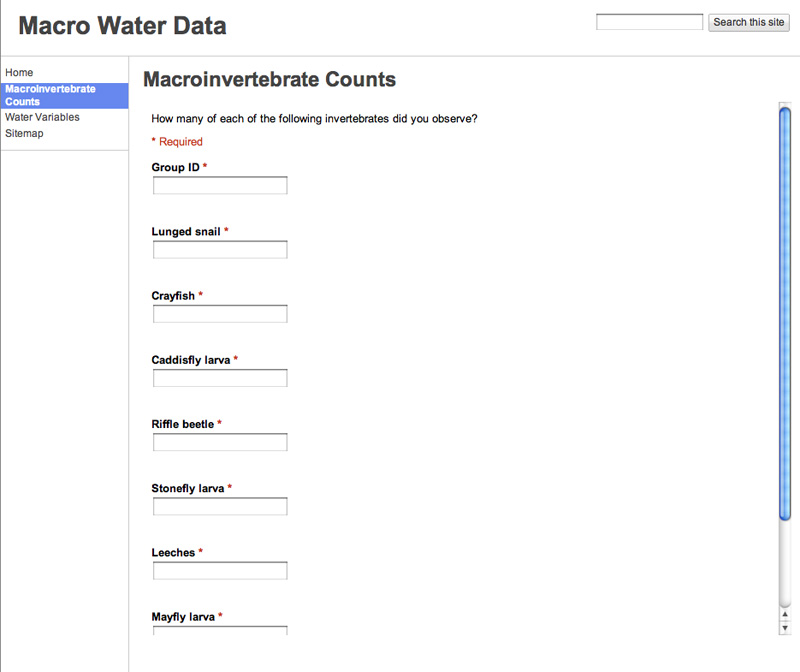
Here is the improved version of this system. The flip chart grid resembles a spreadsheet and it turns out there is a convenient way to aggregate the data from the many individual groups, even across days, in a single spreadsheet and share these data to all schools. Google offers a free online service called Google Docs. This site allows users to use a web browser to create documents and manipulate spreadsheets over the Internet. There are several interesting advantages to this system in addition to the fact that it is free. First, the documents exist on a Google server so that the same document be easily accessed from multiple locations. In this case, students in different schools and different classrooms can connect to the same document. Second, the documents can be shared so that different individuals can not only view the documents, but also modify the contents of a document. Access can be controlled so access is made available only to those who should have access. Finally, in this case, the intent was to collect data in a spreadsheet, but not to allow access to the spreadsheet until all data had been submitted (this is kind of the online version of covering up the existing data with sticky notes). Google offers a simple procedure for adding data to a spreadsheet using what is called a form. A form is a web page that allows the entry of information (e.g., text, numbers) and then submits these data to a remote site. Google docs offers a simple way to create a form. Access to this form is then provided through email or by sharing the web address where the form can be found. Data submitted are automatically stored in a Google spreadsheet. So, each group of students could enter and submit the data they collected using a Google form. This input could be collected in a common spreadsheet and this spreadsheet shared with all participants once all groups had added their data.
Themes
This example describes learning activities in an unusual setting, but illustrates many of the themes we identified in the Primer. The uses of technology we describe here were integrated in the sense that the technology was used to facilitate content area instruction (e.g., mostly life science). The technology offered an active and authentic role for the students. It was hands-on, but the technology was used to collect data requiring interpretation or to capture images allowing identification of specimens that were indicators of good or poor quality water and it is this focus on reasoning from data that is the activity of interest. The data collection techniques students used were similar to the techniques that scientists might use. Students sometimes worked collaboratively sharing data or working together in producing a product (e.g., video summarizing the trip). We would argue that the use of technology was efficient. Students were familiar with digital photography and the use of the digital probes was more efficient than the older data collection techniques the probes replaced. Photography and photo sharing, the use of probes in science laboratories, video editing, and the use of spreadsheets are also likely to be used in future learning tasks.