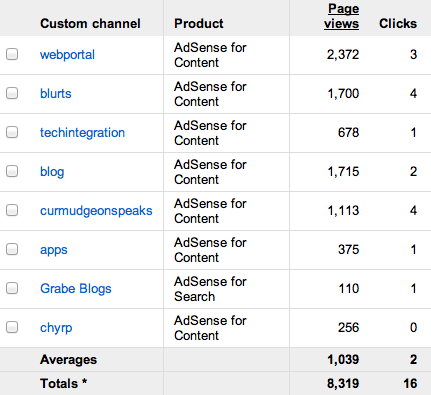
I thought some who have viewed our content may find the following of interest. You may have noticed that we place Google ads on our content (each page of the blogs and the “index” pages of our long format content). Aside from generating a little revenue (far less than the cost of purchasing the server services we use), the ads provide some data (Google analytics). The first figure shows the total number of ad displays (not page views as indicated because not all pages contain an ad) and the number of times an ad was clicked (this is what generates the revenue). If you have ever wondered what the ratio of ad views to clicks might be, this gives you an idea.
The following image offers some information regarding the relative popularity of different resources (webportal and techintegration are the long form resources. Blurts, blog, apps, & curmudgeonspeaks are the blogs. The two table summaries do not match because views of individual blog posts do not show up in the second table, but are included in the total (first chart)
![]()


You must be logged in to post a comment.